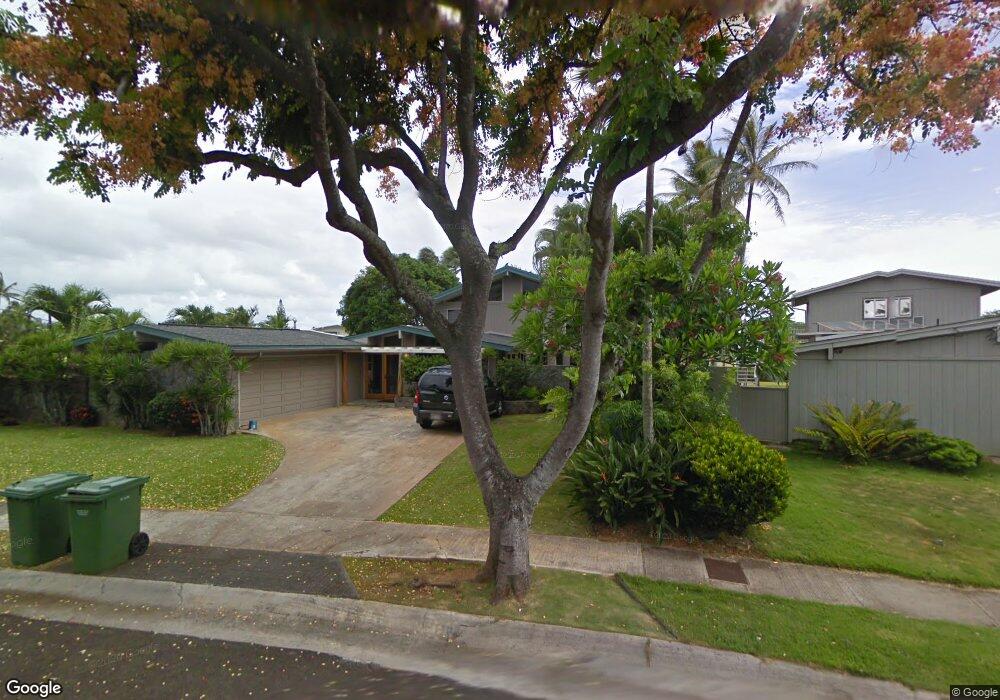
501 Paokano Loop Kailua, HI 96734
Estimated Value: $2,296,000 - $2,611,000
3
Beds
4
Baths
2,878
Sq Ft
$859/Sq Ft
Est. Value
About This Home
This home is located at 501 Paokano Loop, Kailua, HI 96734 and is currently estimated at $2,471,002, approximately $858 per square foot. 501 Paokano Loop is a home located in Honolulu County with nearby schools including Enchanted Lake Elementary School, Kailua Intermediate School, and Kailua High School.
Ownership History
Date
Name
Owned For
Owner Type
Purchase Details
Closed on
Feb 26, 2021
Sold by
Pacarro Gary A and Pacarro Gwen G
Bought by
Gary A Pacarro Revocable Trust and Gwen G Pacarro Revocable Trust
Current Estimated Value
Home Financials for this Owner
Home Financials are based on the most recent Mortgage that was taken out on this home.
Original Mortgage
$647,000
Outstanding Balance
$579,990
Interest Rate
2.7%
Mortgage Type
New Conventional
Estimated Equity
$1,891,012
Purchase Details
Closed on
Jul 17, 2001
Sold by
Pacarro Gary A and Pacarro Gwen G
Bought by
Pacarro Gary A and Gary A Pacarro Revocable Trust
Purchase Details
Closed on
Nov 24, 1998
Sold by
Heim Lawrence S and Heim Lawrence Stewart
Bought by
Pacarro Gary A and Pacarro Gwen G
Home Financials for this Owner
Home Financials are based on the most recent Mortgage that was taken out on this home.
Original Mortgage
$452,000
Interest Rate
6.84%
Create a Home Valuation Report for This Property
The Home Valuation Report is an in-depth analysis detailing your home's value as well as a comparison with similar homes in the area
Home Values in the Area
Average Home Value in this Area
Purchase History
| Date | Buyer | Sale Price | Title Company |
|---|---|---|---|
| Gary A Pacarro Revocable Trust | -- | First American Title Of Hawaii | |
| Pacarro Gary A | -- | Fam | |
| Pacarro Gary A | -- | Fam | |
| Pacarro Gary A | -- | Fam | |
| Pacarro Gary A | -- | Fam | |
| Pacarro Gary A | -- | Fam | |
| Pacarro Gary A | -- | Fam | |
| Pacarro Gary A | -- | -- | |
| Pacarro Gary A | $565,000 | -- |
Source: Public Records
Mortgage History
| Date | Status | Borrower | Loan Amount |
|---|---|---|---|
| Open | Pacarro Gary A | $647,000 | |
| Closed | Pacarro Gary A | $647,000 | |
| Previous Owner | Pacarro Gary A | $452,000 |
Source: Public Records
Tax History Compared to Growth
Tax History
| Year | Tax Paid | Tax Assessment Tax Assessment Total Assessment is a certain percentage of the fair market value that is determined by local assessors to be the total taxable value of land and additions on the property. | Land | Improvement |
|---|---|---|---|---|
| 2025 | $7,975 | $2,257,800 | $1,795,600 | $462,200 |
| 2024 | $7,975 | $2,438,700 | $1,795,600 | $643,100 |
| 2023 | $7,028 | $2,303,800 | $1,795,600 | $508,200 |
| 2022 | $7,028 | $2,148,000 | $1,603,200 | $544,800 |
| 2021 | $5,658 | $1,756,600 | $1,229,100 | $527,500 |
| 2020 | $4,942 | $1,551,900 | $1,229,100 | $322,800 |
| 2019 | $5,026 | $1,555,900 | $1,250,500 | $305,400 |
| 2018 | $4,798 | $1,490,900 | $1,158,500 | $332,400 |
| 2017 | $4,391 | $1,374,500 | $1,024,100 | $350,400 |
| 2016 | $4,090 | $1,248,700 | $931,000 | $317,700 |
| 2015 | $6,689 | $1,114,800 | $806,800 | $308,000 |
| 2014 | $3,762 | $1,107,700 | $790,700 | $317,000 |
Source: Public Records
Map
Nearby Homes
- 519 Wanaao Rd
- 279 Kakahiaka St
- 507 Kawailoa Rd Unit B
- 411 Kaelepulu Dr Unit E
- 358 Kaelepulu Dr Unit 702
- 358D Kaelepulu Dr Unit 704
- 391 Kaelepulu Dr Unit A
- 350 Kaelepulu Dr Unit 401
- 481 Kawailoa Rd Unit B
- 389 Kaelepulu Dr Unit 1501
- 348H Kaelepulu Dr Unit 608
- 29 Alala Rd
- 465 Kawailoa Rd
- 976 Kalawai Place Unit 4B
- 757 Akumu St
- 150 Kailua Rd
- 1015 Aoloa Place Unit 437
- 1015 Aoloa Place Unit 250
- 1015 Aoloa Place Unit 218
- 141 Kuukama St