Estimated Value: $182,000 - $207,313
2
Beds
2
Baths
1,104
Sq Ft
$179/Sq Ft
Est. Value
About This Home
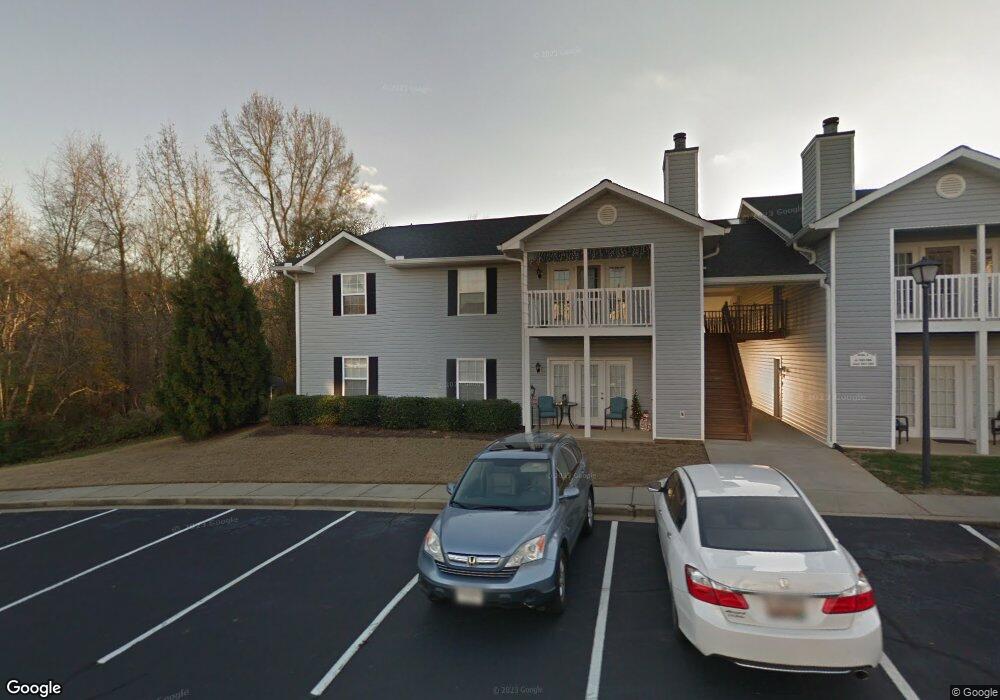
This home is located at 501 Pelham Square Way Unit 501, Greer, SC 29650 and is currently estimated at $197,078, approximately $178 per square foot. 501 Pelham Square Way Unit 501 is a home located in Greenville County with nearby schools including Buena Vista Elementary School, Northwood Middle School, and Eastside High School.
Ownership History
Date
Name
Owned For
Owner Type
Purchase Details
Closed on
Mar 27, 2013
Sold by
Federal National Mortgage Association
Bought by
Yacu Raad and Yacu Maro
Current Estimated Value
Purchase Details
Closed on
Dec 5, 2012
Sold by
Chang Horacio V and Chang Nancy
Bought by
Federal National Mortgage Association
Purchase Details
Closed on
Sep 21, 2007
Sold by
Gebhard Leisa K
Bought by
Chang Horacio V and Chang Nancy
Home Financials for this Owner
Home Financials are based on the most recent Mortgage that was taken out on this home.
Original Mortgage
$96,500
Interest Rate
6.55%
Mortgage Type
Purchase Money Mortgage
Purchase Details
Closed on
Jun 3, 2004
Sold by
Secretary Of Housing And Urban
Bought by
Gebhard Leisa K
Purchase Details
Closed on
Mar 16, 2004
Sold by
Secretary Of Housing And Urban
Bought by
Gebhard Leisa K
Purchase Details
Closed on
Sep 4, 2001
Sold by
Pierce Homes Of Carolina Llc
Bought by
Cofer Beverly F
Create a Home Valuation Report for This Property
The Home Valuation Report is an in-depth analysis detailing your home's value as well as a comparison with similar homes in the area
Home Values in the Area
Average Home Value in this Area
Purchase History
| Date | Buyer | Sale Price | Title Company |
|---|---|---|---|
| Yacu Raad | $65,000 | -- | |
| Federal National Mortgage Association | $80,000 | -- | |
| Chang Horacio V | $96,500 | None Available | |
| Gebhard Leisa K | $65,000 | -- | |
| Gebhard Leisa K | $10,000 | -- | |
| Cofer Beverly F | $86,050 | -- |
Source: Public Records
Mortgage History
| Date | Status | Borrower | Loan Amount |
|---|---|---|---|
| Previous Owner | Chang Horacio V | $96,500 |
Source: Public Records
Tax History Compared to Growth
Tax History
| Year | Tax Paid | Tax Assessment Tax Assessment Total Assessment is a certain percentage of the fair market value that is determined by local assessors to be the total taxable value of land and additions on the property. | Land | Improvement |
|---|---|---|---|---|
| 2024 | $1,871 | $5,670 | $790 | $4,880 |
| 2023 | $1,812 | $5,670 | $790 | $4,880 |
| 2022 | $1,683 | $5,670 | $790 | $4,880 |
| 2021 | $1,658 | $5,670 | $790 | $4,880 |
| 2020 | $1,537 | $4,940 | $960 | $3,980 |
| 2019 | $1,522 | $4,940 | $960 | $3,980 |
| 2018 | $1,557 | $4,940 | $960 | $3,980 |
| 2017 | $1,525 | $4,940 | $960 | $3,980 |
| 2016 | $1,468 | $82,300 | $16,000 | $66,300 |
| 2015 | $1,458 | $82,300 | $16,000 | $66,300 |
| 2014 | $1,666 | $95,630 | $16,000 | $79,630 |
Source: Public Records
Map
Nearby Homes
- 102 Pelham Square Way
- 1004 Pelham Square Way Unit 1004
- 405 Welsh Poppy Way
- 207 Bell Heather Ln
- 108 Royal Troon Ct
- 18 Abington Hall Ct
- 122 Antigua Way
- 17 Springhead Way
- 322 Ascot Ridge Ln
- 124 Antigua Way
- 334 Ascot Ridge Ln
- 111 Antigua Way
- 407 Sugar Mill Rd
- 105 Sugar Mill Ct
- 211 Aldgate Way
- 309 Hillsdale Dr
- 422 Palazzo Place
- 414 Palazzo Place
- 548 Lifescape Ln
- 301 Deerfield Dr
- 502 Pelham Square Way
- 504 Pelham Square Way Unit 504
- 503 Pelham Square Way
- 505 Pelham Square Way Unit 505
- 508 Pelham Square Way
- 506 Pelham Square Way
- 507 Pelham Square Way
- 604 Pelham Square Way Unit 604
- 601 Pelham Square Way
- 402 Pelham Square Way Unit 402
- 603 Pelham Square Way
- 405 Pelham Square Way Unit 405
- 401 Pelham Square Way
- 401 Pelham Square Way Unit 401
- 602 Pelham Square Way Unit 602
- 406 Pelham Square Way Unit 406
- 403 Pelham Square Way
- 408 Pelham Square Way
- 404 Pelham Square Way
- 407 Pelham Square Way