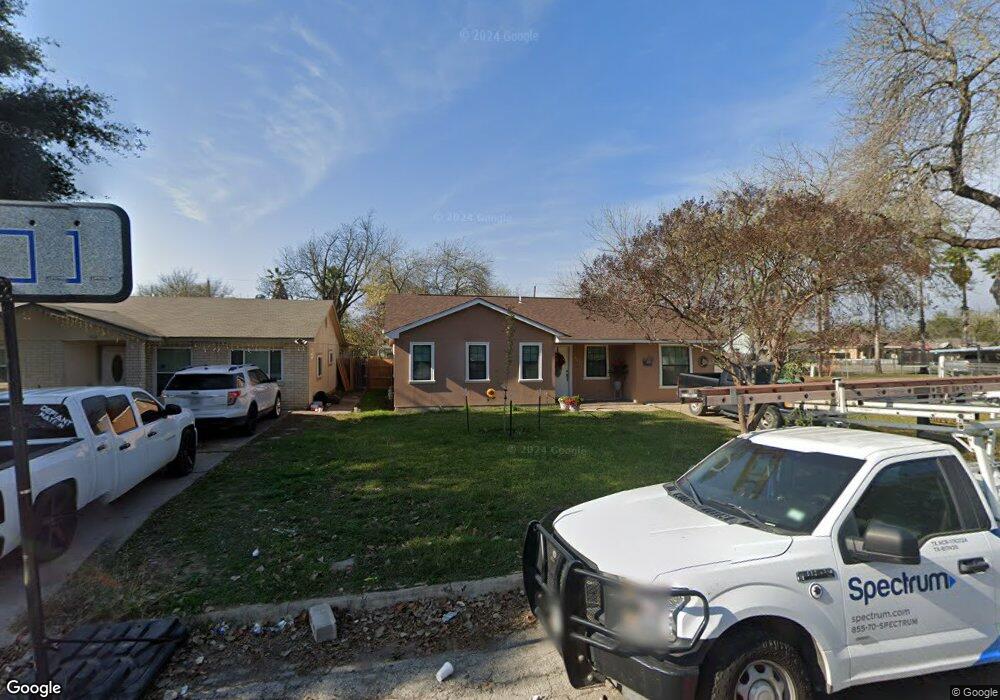
501 Perez St Uvalde, TX 78801
Estimated Value: $176,000 - $269,000
4
Beds
2
Baths
1,500
Sq Ft
$136/Sq Ft
Est. Value
About This Home
This home is located at 501 Perez St, Uvalde, TX 78801 and is currently estimated at $203,252, approximately $135 per square foot. 501 Perez St is a home located in Uvalde County with nearby schools including Uvalde High School, Sacred Heart Parish School, and St. Philip's Episcopal School.
Ownership History
Date
Name
Owned For
Owner Type
Purchase Details
Closed on
Dec 4, 2020
Sold by
Castillo Juan Usbaldo and Castillo Rosalinda L
Bought by
Contreras Dionicio R
Current Estimated Value
Home Financials for this Owner
Home Financials are based on the most recent Mortgage that was taken out on this home.
Original Mortgage
$148,200
Outstanding Balance
$131,877
Interest Rate
2.8%
Mortgage Type
New Conventional
Estimated Equity
$71,375
Purchase Details
Closed on
Jun 14, 2019
Sold by
Vasquez Marganta R
Bought by
Castillo Juan Usbaldo and Castillo Rosalinda L
Home Financials for this Owner
Home Financials are based on the most recent Mortgage that was taken out on this home.
Original Mortgage
$26,000
Interest Rate
4.1%
Mortgage Type
Commercial
Purchase Details
Closed on
Mar 5, 2018
Sold by
Vasquez Abel
Bought by
Vasquez Margarita R
Create a Home Valuation Report for This Property
The Home Valuation Report is an in-depth analysis detailing your home's value as well as a comparison with similar homes in the area
Home Values in the Area
Average Home Value in this Area
Purchase History
| Date | Buyer | Sale Price | Title Company |
|---|---|---|---|
| Contreras Dionicio R | -- | Chicago Title | |
| Castillo Juan Usbaldo | -- | Chicago Title | |
| Vasquez Margarita R | -- | None Available |
Source: Public Records
Mortgage History
| Date | Status | Borrower | Loan Amount |
|---|---|---|---|
| Open | Contreras Dionicio R | $148,200 | |
| Previous Owner | Castillo Juan Usbaldo | $26,000 |
Source: Public Records
Tax History Compared to Growth
Tax History
| Year | Tax Paid | Tax Assessment Tax Assessment Total Assessment is a certain percentage of the fair market value that is determined by local assessors to be the total taxable value of land and additions on the property. | Land | Improvement |
|---|---|---|---|---|
| 2025 | $3,997 | $178,503 | $31,395 | $147,108 |
| 2024 | $3,294 | $170,520 | $23,412 | $147,108 |
| 2023 | $3,979 | $194,331 | $23,412 | $170,919 |
| 2022 | $3,796 | $152,119 | $18,747 | $133,372 |
| 2021 | $3,656 | $133,759 | $16,505 | $117,254 |
| 2020 | $2,705 | $97,049 | $13,724 | $83,325 |
| 2019 | $1,441 | $66,308 | $13,724 | $52,584 |
| 2018 | $1,391 | $66,308 | $13,724 | $52,584 |
| 2017 | $1,247 | $67,474 | $14,890 | $52,584 |
| 2016 | $1,134 | $67,474 | $14,890 | $52,584 |
| 2015 | -- | $34,583 | $5,920 | $28,663 |
| 2014 | -- | $37,165 | $5,920 | $31,245 |
Source: Public Records
Map
Nearby Homes