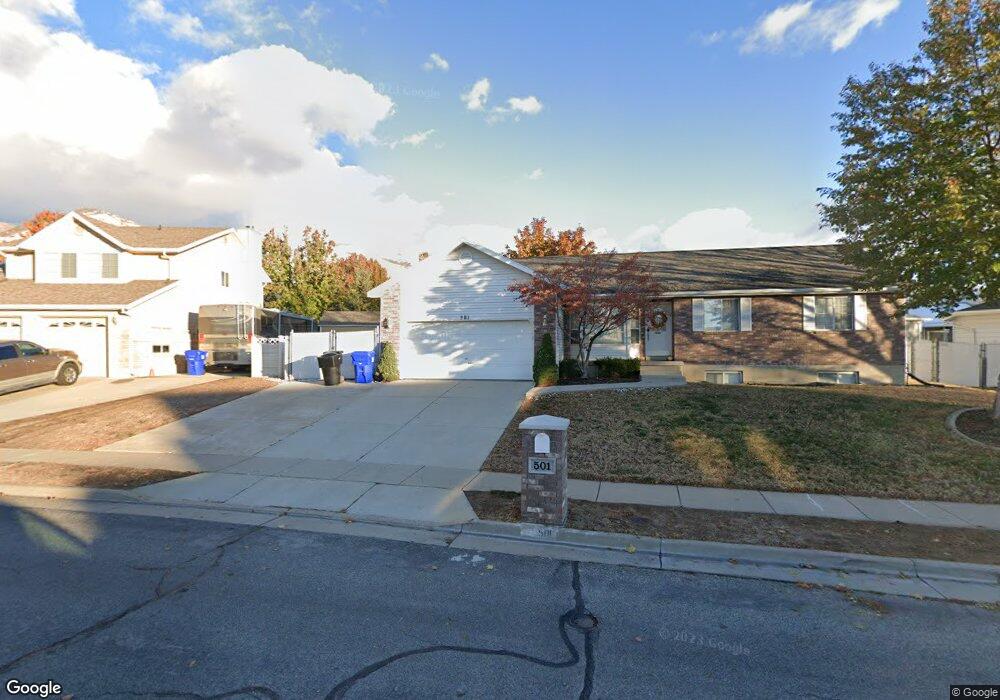
501 Pitford Dr Centerville, UT 84014
Estimated Value: $571,000 - $757,000
5
Beds
3
Baths
2,695
Sq Ft
$242/Sq Ft
Est. Value
About This Home
This home is located at 501 Pitford Dr, Centerville, UT 84014 and is currently estimated at $651,870, approximately $241 per square foot. 501 Pitford Dr is a home located in Davis County with nearby schools including J A Taylor Elementary School, Centerville Jr High, and Viewmont High School.
Ownership History
Date
Name
Owned For
Owner Type
Purchase Details
Closed on
Jun 21, 2019
Sold by
Uesele Dena B
Bought by
Johnson Billy J and Johnson Kara L
Current Estimated Value
Home Financials for this Owner
Home Financials are based on the most recent Mortgage that was taken out on this home.
Original Mortgage
$352,000
Outstanding Balance
$308,867
Interest Rate
4%
Mortgage Type
New Conventional
Estimated Equity
$343,003
Purchase Details
Closed on
Jan 4, 2016
Sold by
Matren Mitch R and Matren Loria A
Bought by
Uesele Dena B
Create a Home Valuation Report for This Property
The Home Valuation Report is an in-depth analysis detailing your home's value as well as a comparison with similar homes in the area
Purchase History
| Date | Buyer | Sale Price | Title Company |
|---|---|---|---|
| Johnson Billy J | -- | Us Title Company | |
| Uesele Dena B | -- | First American Title |
Source: Public Records
Mortgage History
| Date | Status | Borrower | Loan Amount |
|---|---|---|---|
| Open | Johnson Billy J | $352,000 |
Source: Public Records
Tax History Compared to Growth
Tax History
| Year | Tax Paid | Tax Assessment Tax Assessment Total Assessment is a certain percentage of the fair market value that is determined by local assessors to be the total taxable value of land and additions on the property. | Land | Improvement |
|---|---|---|---|---|
| 2025 | $3,203 | $306,350 | $162,451 | $143,899 |
| 2024 | $3,081 | $299,750 | $145,800 | $153,950 |
| 2023 | $2,975 | $287,650 | $131,692 | $155,958 |
| 2022 | $3,148 | $304,700 | $120,847 | $183,853 |
| 2021 | $2,858 | $431,000 | $184,068 | $246,932 |
| 2020 | $2,705 | $395,000 | $180,000 | $215,000 |
| 2019 | $2,499 | $368,000 | $180,864 | $187,136 |
| 2018 | $2,344 | $341,000 | $166,569 | $174,431 |
| 2016 | $1,974 | $159,555 | $53,569 | $105,986 |
| 2015 | $1,855 | $141,460 | $53,569 | $87,891 |
| 2014 | $1,980 | $154,489 | $53,569 | $100,920 |
| 2013 | -- | $133,779 | $39,971 | $93,808 |
Source: Public Records
Map
Nearby Homes