501 Range View Dr Westcliffe, CO 81252
Estimated Value: $381,000 - $593,000
1
Bed
1
Bath
1,104
Sq Ft
$435/Sq Ft
Est. Value
About This Home
This home is located at 501 Range View Dr, Westcliffe, CO 81252 and is currently estimated at $480,384, approximately $435 per square foot. 501 Range View Dr is a home located in Custer County with nearby schools including Custer County Elementary School, Custer Middle School, and Custer County High School.
Ownership History
Date
Name
Owned For
Owner Type
Purchase Details
Closed on
Feb 14, 2023
Sold by
Martin Laurence S
Bought by
Hessing Brock L and Mclaughlin Merrill A
Current Estimated Value
Home Financials for this Owner
Home Financials are based on the most recent Mortgage that was taken out on this home.
Original Mortgage
$360,000
Outstanding Balance
$348,270
Interest Rate
6.12%
Mortgage Type
New Conventional
Estimated Equity
$132,114
Purchase Details
Closed on
Aug 7, 2015
Sold by
Raber Joseph L and Raber Rath J
Bought by
Martin Laurence S and Martin Sheila
Purchase Details
Closed on
Jul 30, 2003
Sold by
Yaklich Ronald E and Yaklich Matthew
Bought by
Yaklich Ronald E
Purchase Details
Closed on
Feb 9, 1999
Sold by
Yaklich Matthew
Bought by
Yaklich Ronald E and Yaklich Matthew
Purchase Details
Closed on
Sep 25, 1997
Sold by
Yaklich Jennifer
Bought by
Yaklich Matthew
Create a Home Valuation Report for This Property
The Home Valuation Report is an in-depth analysis detailing your home's value as well as a comparison with similar homes in the area
Home Values in the Area
Average Home Value in this Area
Purchase History
| Date | Buyer | Sale Price | Title Company |
|---|---|---|---|
| Hessing Brock L | $450,000 | -- | |
| Martin Laurence S | $205,000 | None Available | |
| Yaklich Ronald E | -- | -- | |
| Yaklich Ronald E | -- | -- | |
| Yaklich Matthew | -- | -- |
Source: Public Records
Mortgage History
| Date | Status | Borrower | Loan Amount |
|---|---|---|---|
| Open | Hessing Brock L | $360,000 |
Source: Public Records
Tax History Compared to Growth
Tax History
| Year | Tax Paid | Tax Assessment Tax Assessment Total Assessment is a certain percentage of the fair market value that is determined by local assessors to be the total taxable value of land and additions on the property. | Land | Improvement |
|---|---|---|---|---|
| 2024 | $1,586 | $28,850 | $0 | $0 |
| 2023 | $1,586 | $28,850 | $0 | $0 |
| 2022 | $1,370 | $21,250 | $6,430 | $14,820 |
| 2021 | $1,404 | $21,250 | $6,430 | $14,820 |
| 2020 | $1,310 | $20,060 | $6,430 | $13,630 |
| 2019 | $1,303 | $20,060 | $6,430 | $13,630 |
| 2018 | $989 | $15,140 | $3,170 | $11,970 |
| 2017 | $959 | $15,135 | $3,170 | $11,965 |
| 2016 | $998 | $16,390 | $3,510 | $12,880 |
| 2015 | -- | $205,862 | $44,032 | $161,830 |
| 2012 | $272 | $207,991 | $44,032 | $163,959 |
Source: Public Records
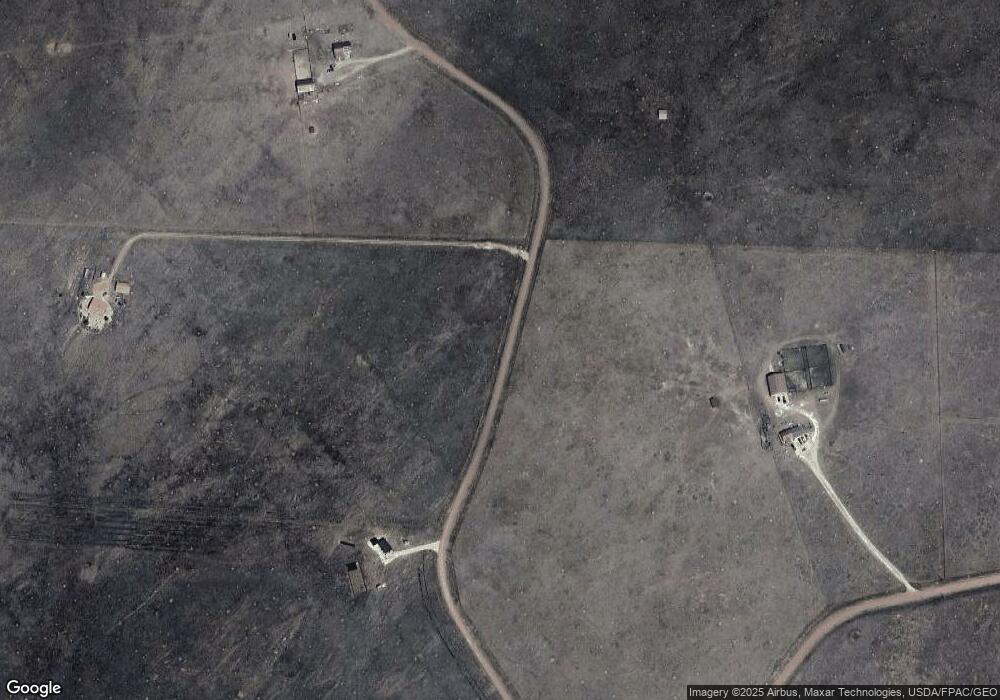
Map
Nearby Homes
- 501 Rangeview Dr
- 335 Range View Dr
- 668 Rangeview Dr
- 667 Rangeview Dr
- 1209 Lone Tree Cir
- 1209 Lone Tree Cir Unit 14
- 1307 Range View Dr
- 1336 Lone Tree Cir
- 0 County Road 238
- 1153 Range View Dr
- TBD Rangeview Dr
- 1769 Range View Dr
- 1461 Range View Dr
- 1498 Lone Tree Cir
- 61192 Colorado 69
- 1547 Lone Tree Cir
- 61192 State Highway 69
- 872 Lone Tree Cir Unit 24
- 1771 County Road 238
- 61211 State Highway 69