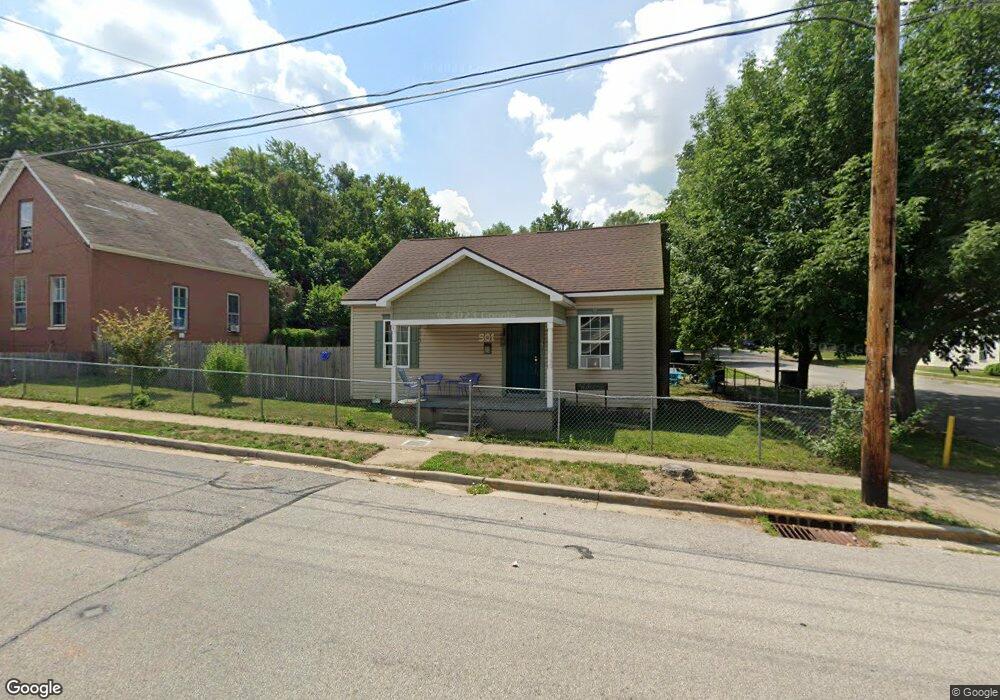
501 Romig St Lafayette, IN 47901
Ellsworth Romig NeighborhoodEstimated Value: $85,000 - $176,000
--
Bed
--
Bath
1,178
Sq Ft
$120/Sq Ft
Est. Value
About This Home
This home is located at 501 Romig St, Lafayette, IN 47901 and is currently estimated at $141,927, approximately $120 per square foot. 501 Romig St is a home located in Tippecanoe County with nearby schools including Thomas Miller Elementary School, Sunnyside Intermediate School, and Lafayette Tecumseh Junior High School.
Ownership History
Date
Name
Owned For
Owner Type
Purchase Details
Closed on
Mar 6, 2017
Sold by
Smith Larry and Smith Frank E
Bought by
Smith Frank E and Tyra Shana Lace
Current Estimated Value
Purchase Details
Closed on
Feb 18, 2015
Sold by
Smith Larry and Smith Frank E
Bought by
Smith Larry and Smith Frank E
Purchase Details
Closed on
May 3, 2012
Sold by
Smith Larry
Bought by
Smith Larry and Smith Frank E
Purchase Details
Closed on
Sep 10, 2002
Sold by
Smith Rachel
Bought by
Smith Larry
Purchase Details
Closed on
Jul 25, 2001
Sold by
Harvel Joe D and Stevenson David L
Bought by
Smith Rachel
Create a Home Valuation Report for This Property
The Home Valuation Report is an in-depth analysis detailing your home's value as well as a comparison with similar homes in the area
Home Values in the Area
Average Home Value in this Area
Purchase History
| Date | Buyer | Sale Price | Title Company |
|---|---|---|---|
| Smith Frank E | -- | -- | |
| Smith Larry | -- | -- | |
| Smith Larry | -- | None Available | |
| Smith Larry | -- | -- | |
| Smith Rachel | -- | -- |
Source: Public Records
Tax History Compared to Growth
Tax History
| Year | Tax Paid | Tax Assessment Tax Assessment Total Assessment is a certain percentage of the fair market value that is determined by local assessors to be the total taxable value of land and additions on the property. | Land | Improvement |
|---|---|---|---|---|
| 2024 | $409 | $79,400 | $9,800 | $69,600 |
| 2023 | $380 | $74,100 | $9,800 | $64,300 |
| 2022 | $362 | $59,800 | $9,800 | $50,000 |
| 2021 | $344 | $55,200 | $9,800 | $45,400 |
| 2020 | $307 | $50,500 | $9,800 | $40,700 |
| 2019 | $305 | $50,700 | $10,000 | $40,700 |
| 2018 | $294 | $48,800 | $10,000 | $38,800 |
| 2017 | $284 | $47,800 | $10,000 | $37,800 |
| 2016 | $271 | $46,700 | $10,000 | $36,700 |
| 2014 | $563 | $60,600 | $10,000 | $50,600 |
| 2013 | $313 | $54,300 | $10,000 | $44,300 |
Source: Public Records
Map
Nearby Homes