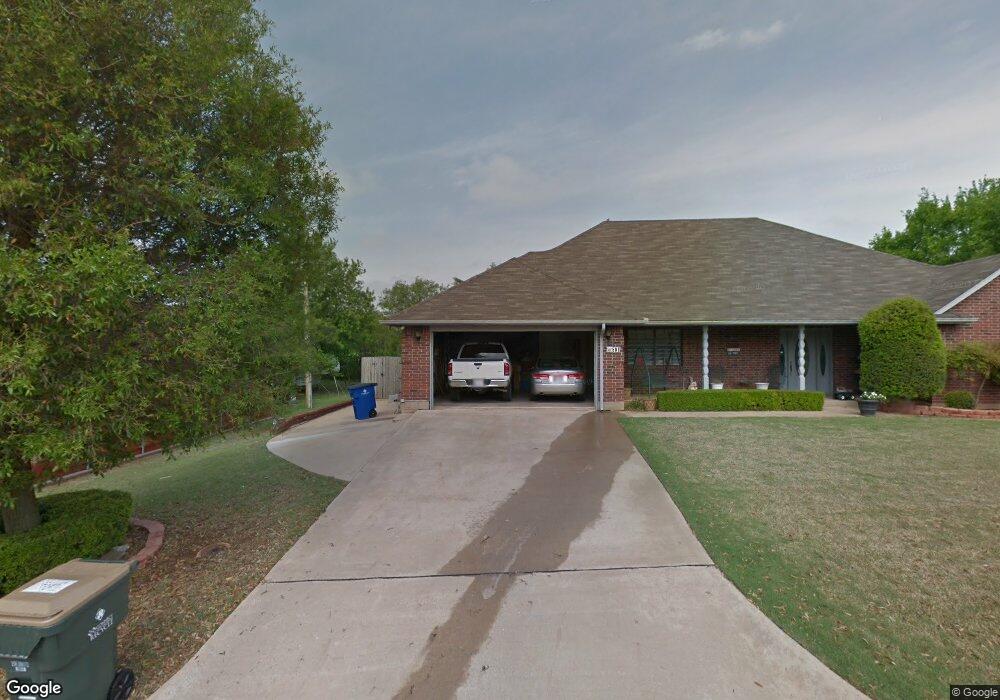
501 S Cedar Creek St Duncan, OK 73533
Estimated Value: $200,000 - $229,000
3
Beds
3
Baths
1,930
Sq Ft
$112/Sq Ft
Est. Value
About This Home
This home is located at 501 S Cedar Creek St, Duncan, OK 73533 and is currently estimated at $216,530, approximately $112 per square foot. 501 S Cedar Creek St is a home located in Stephens County with nearby schools including Mark Twain Elementary School, Duncan Middle School, and Duncan High School.
Ownership History
Date
Name
Owned For
Owner Type
Purchase Details
Closed on
Oct 22, 2024
Sold by
Holbrook George and Holbrook Shicole
Bought by
Padilla Ernesto Lopez
Current Estimated Value
Home Financials for this Owner
Home Financials are based on the most recent Mortgage that was taken out on this home.
Original Mortgage
$179,783
Outstanding Balance
$172,506
Interest Rate
5.47%
Mortgage Type
New Conventional
Estimated Equity
$44,024
Purchase Details
Closed on
May 30, 2014
Sold by
Martin Larry and Martin Shirley
Bought by
Holbrook George and Holbrook Shicole
Home Financials for this Owner
Home Financials are based on the most recent Mortgage that was taken out on this home.
Original Mortgage
$134,763
Interest Rate
4.25%
Mortgage Type
FHA
Purchase Details
Closed on
Aug 8, 1996
Sold by
Lewis Lewis M and Lewis J
Create a Home Valuation Report for This Property
The Home Valuation Report is an in-depth analysis detailing your home's value as well as a comparison with similar homes in the area
Purchase History
| Date | Buyer | Sale Price | Title Company |
|---|---|---|---|
| Padilla Ernesto Lopez | $218,000 | Old Republic Title | |
| Holbrook George | $137,500 | None Available | |
| -- | $5,000 | -- |
Source: Public Records
Mortgage History
| Date | Status | Borrower | Loan Amount |
|---|---|---|---|
| Open | Padilla Ernesto Lopez | $179,783 | |
| Previous Owner | Holbrook George | $134,763 |
Source: Public Records
Tax History
| Year | Tax Paid | Tax Assessment Tax Assessment Total Assessment is a certain percentage of the fair market value that is determined by local assessors to be the total taxable value of land and additions on the property. | Land | Improvement |
|---|---|---|---|---|
| 2025 | $2,031 | $24,077 | $997 | $23,080 |
| 2024 | $1,209 | $15,193 | $997 | $14,196 |
| 2023 | $1,209 | $15,193 | $997 | $14,196 |
| 2022 | $1,133 | $14,750 | $997 | $13,753 |
| 2021 | $1,134 | $14,321 | $997 | $13,324 |
| 2020 | $1,079 | $13,499 | $997 | $12,502 |
| 2019 | $1,061 | $13,263 | $997 | $12,266 |
| 2018 | $1,058 | $12,877 | $997 | $11,880 |
| 2017 | $1,179 | $14,721 | $997 | $13,724 |
| 2016 | $1,212 | $15,253 | $997 | $14,256 |
| 2015 | $1,248 | $15,253 | $997 | $14,256 |
| 2014 | $1,248 | $14,510 | $660 | $13,850 |
Source: Public Records
Map
Nearby Homes
- 2622 Highcrest Dr
- 602 Fieldcrest Dr
- TBD S 27th St
- 2110 W Main St
- 2150 W Main St
- 208 N 29th St
- 261 N 29th St
- 0 W Beech Ave
- 209 N 22nd St
- 2006 W Oak Ave
- 174831 N 2844 Rd
- 1905 W Ash Ave
- 2210 Western Dr
- 1705 W Ash Ave
- 123 N Highway 81
- 168466 9 Mile Rd
- 1377 Drexal Place
- 711 S 12th St
- 27 N 14th St
- 2002 Redbud Ave
- 501 501 S Cedar Creek St
- 507 S Cedar Creek St
- 511 S Cedar Creek St
- 2708 Highcrest Dr
- 2713 Martin Ln
- 2713 2713 Martin Ln
- 2713 Highcrest Dr
- 605 S Cedar Creek St
- 2704 Highcrest Dr
- 2709 Martin Ln
- 2709 Highcrest Dr
- 2701 Martin Ln
- 2705 Highcrest Dr
- 609 S Cedar Creek St
- 2705 Martin Ln
- 2701 Highcrest Dr
- 421 S 27th St Unit I4
- 2618 Highcrest Dr
- 280331 Tanglewood Dr
- 610 S Cedar Creek St
Your Personal Tour Guide
Ask me questions while you tour the home.