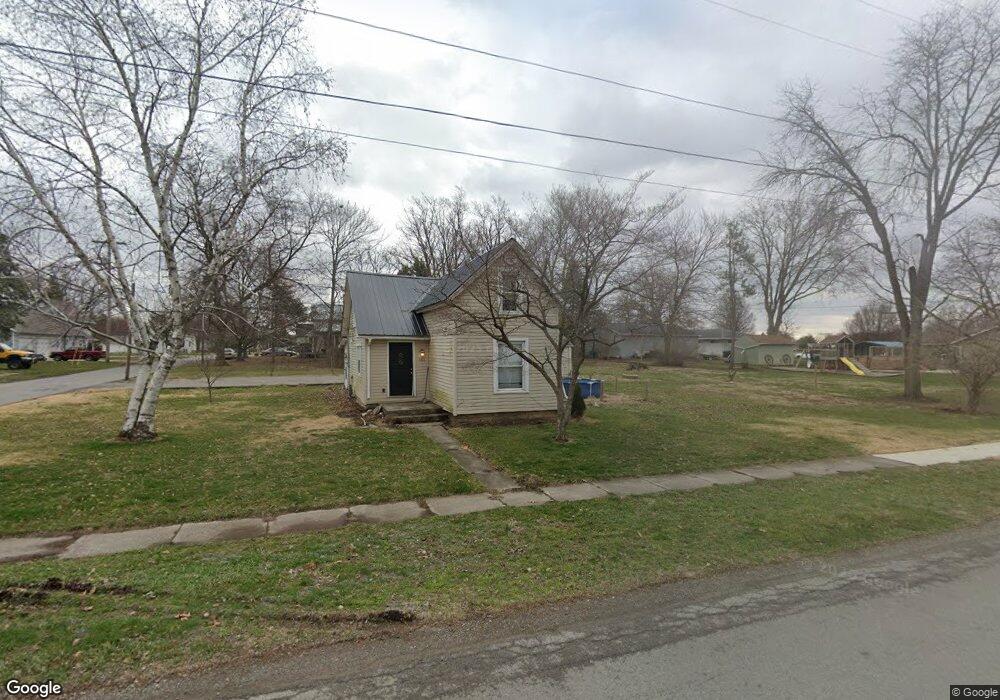
501 S Jefferson St Pandora, OH 45877
Estimated Value: $182,000 - $200,000
3
Beds
1
Bath
1,976
Sq Ft
$97/Sq Ft
Est. Value
About This Home
This home is located at 501 S Jefferson St, Pandora, OH 45877 and is currently estimated at $191,815, approximately $97 per square foot. 501 S Jefferson St is a home located in Putnam County with nearby schools including Pandora-Gilboa Elementary School, Pandora-Gilboa Middle School, and Pandora-Gilboa High School.
Ownership History
Date
Name
Owned For
Owner Type
Purchase Details
Closed on
May 17, 2013
Sold by
Zuercher Andrew C and Zuercher Rachel M
Bought by
Arthur Caleb K and Arthur Jessica M
Current Estimated Value
Home Financials for this Owner
Home Financials are based on the most recent Mortgage that was taken out on this home.
Original Mortgage
$76,950
Outstanding Balance
$54,306
Interest Rate
3.39%
Mortgage Type
New Conventional
Estimated Equity
$137,509
Purchase Details
Closed on
Mar 14, 2012
Sold by
Neal Jill E and Neal Wayne M
Bought by
Zuercher Andrew C and Zuercher Rachel M
Home Financials for this Owner
Home Financials are based on the most recent Mortgage that was taken out on this home.
Original Mortgage
$58,980
Interest Rate
3.88%
Mortgage Type
New Conventional
Purchase Details
Closed on
Oct 4, 2003
Bought by
Neal Jill E
Create a Home Valuation Report for This Property
The Home Valuation Report is an in-depth analysis detailing your home's value as well as a comparison with similar homes in the area
Home Values in the Area
Average Home Value in this Area
Purchase History
| Date | Buyer | Sale Price | Title Company |
|---|---|---|---|
| Arthur Caleb K | $81,000 | Attorney | |
| Zuercher Andrew C | $81,000 | Attorney | |
| Neal Jill E | $55,000 | -- |
Source: Public Records
Mortgage History
| Date | Status | Borrower | Loan Amount |
|---|---|---|---|
| Open | Arthur Caleb K | $76,950 | |
| Closed | Zuercher Andrew C | $58,980 |
Source: Public Records
Tax History Compared to Growth
Tax History
| Year | Tax Paid | Tax Assessment Tax Assessment Total Assessment is a certain percentage of the fair market value that is determined by local assessors to be the total taxable value of land and additions on the property. | Land | Improvement |
|---|---|---|---|---|
| 2024 | $1,254 | $45,060 | $5,400 | $39,660 |
| 2023 | $1,289 | $31,460 | $4,240 | $27,220 |
| 2022 | $1,180 | $31,459 | $4,239 | $27,220 |
| 2021 | $1,182 | $31,460 | $4,240 | $27,220 |
| 2020 | $1,180 | $27,130 | $3,780 | $23,350 |
| 2019 | $1,048 | $28,870 | $4,240 | $24,630 |
| 2018 | $1,032 | $28,870 | $4,240 | $24,630 |
| 2017 | $1,019 | $28,870 | $4,240 | $24,630 |
| 2016 | $909 | $27,130 | $3,780 | $23,350 |
| 2015 | $918 | $27,130 | $3,780 | $23,350 |
| 2014 | $899 | $27,130 | $3,780 | $23,350 |
| 2013 | $833 | $27,130 | $3,780 | $23,350 |
Source: Public Records
Map
Nearby Homes
- 208 E Monroe St
- 101 Maplewood Dr
- 17429 Road 5
- 8160 Columbus Grove-Bluffton Rd
- 10755 Bixel Rd
- 349 Sycamore Ct
- 110 Magnolia Ln
- 182 Sunset Dr
- 152 Chestnut Ln
- 0 Columbus Grove-Bluffton Rd
- 222 Grove St
- 212 S Lawn Ave
- 217 Grove St
- 222 N Lawn Ave
- 513 S Jackson St
- 307 Parkview Dr
- 210 N Jackson St
- 305 Parkview Dr
- 313 Parkview Dr
- 315 Parkview Dr
- 108 South Ave
- 407 S Jefferson St
- 505 S Jefferson St
- 502 S Jefferson St
- 205 Walnut St
- 405 S Jefferson St
- 412 S Jefferson St
- 412 N High St
- 508 S Jefferson St
- 408 S High St
- 410 S Jefferson St
- 202 South Ave
- 408 S Jefferson St
- 207 Walnut St
- 403 S Jefferson St
- 406 S High
- 201 South Ave
- 406 S Jefferson St
- 404 S High St