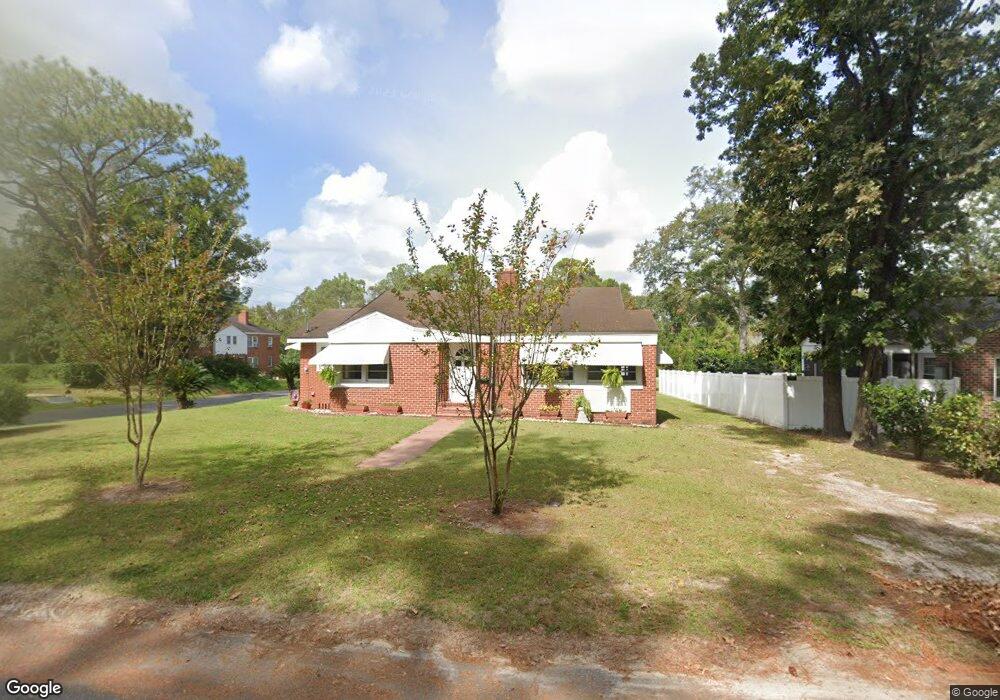
501 Scruggs St Waycross, GA 31501
Estimated Value: $131,000 - $156,000
2
Beds
1
Bath
1,514
Sq Ft
$94/Sq Ft
Est. Value
About This Home
This home is located at 501 Scruggs St, Waycross, GA 31501 and is currently estimated at $142,870, approximately $94 per square foot. 501 Scruggs St is a home located in Ware County with nearby schools including Williams Heights Elementary School, Waycross Middle School, and Ware County High School.
Ownership History
Date
Name
Owned For
Owner Type
Purchase Details
Closed on
Nov 19, 2021
Sold by
Allen Michael Paul
Bought by
Chappell Mary E
Current Estimated Value
Home Financials for this Owner
Home Financials are based on the most recent Mortgage that was taken out on this home.
Original Mortgage
$96,903
Outstanding Balance
$88,531
Interest Rate
3.09%
Mortgage Type
New Conventional
Estimated Equity
$54,339
Purchase Details
Closed on
Aug 15, 2018
Sold by
Allen Sandra Elizabeth Estate
Bought by
Allen Michael Paul
Purchase Details
Closed on
Mar 2, 2016
Sold by
Allen Michael P
Bought by
Allen Sandra E
Purchase Details
Closed on
Dec 1, 2015
Sold by
Allen Sandra E
Bought by
Allen Michael P
Purchase Details
Closed on
Feb 17, 2006
Sold by
Odom Edna
Bought by
Allen Sandra E
Home Financials for this Owner
Home Financials are based on the most recent Mortgage that was taken out on this home.
Original Mortgage
$46,800
Interest Rate
6.04%
Mortgage Type
New Conventional
Create a Home Valuation Report for This Property
The Home Valuation Report is an in-depth analysis detailing your home's value as well as a comparison with similar homes in the area
Home Values in the Area
Average Home Value in this Area
Purchase History
| Date | Buyer | Sale Price | Title Company |
|---|---|---|---|
| Chappell Mary E | $99,900 | -- | |
| Allen Michael Paul | -- | -- | |
| Allen Sandra E | -- | -- | |
| Allen Sandra E | -- | -- | |
| Allen Michael P | -- | -- | |
| Allen Sandra E | $58,500 | -- |
Source: Public Records
Mortgage History
| Date | Status | Borrower | Loan Amount |
|---|---|---|---|
| Open | Chappell Mary E | $96,903 | |
| Previous Owner | Allen Sandra E | $46,800 |
Source: Public Records
Tax History Compared to Growth
Tax History
| Year | Tax Paid | Tax Assessment Tax Assessment Total Assessment is a certain percentage of the fair market value that is determined by local assessors to be the total taxable value of land and additions on the property. | Land | Improvement |
|---|---|---|---|---|
| 2024 | $458 | $57,530 | $2,560 | $54,970 |
| 2023 | $467 | $37,113 | $2,043 | $35,070 |
| 2022 | $525 | $37,171 | $2,043 | $35,128 |
| 2021 | $1,423 | $32,905 | $2,043 | $30,862 |
| 2020 | $1,238 | $28,416 | $2,043 | $26,373 |
| 2019 | $1,215 | $27,481 | $2,043 | $25,438 |
| 2018 | $106 | $26,545 | $2,043 | $24,502 |
| 2017 | $947 | $26,545 | $2,043 | $24,502 |
| 2016 | $947 | $26,484 | $1,982 | $24,502 |
| 2015 | $953 | $26,484 | $1,982 | $24,502 |
| 2014 | $952 | $26,484 | $1,982 | $24,502 |
| 2013 | -- | $24,172 | $1,981 | $22,190 |
Source: Public Records
Map
Nearby Homes
- 415 Dewey St
- 502 Dewey St
- 807 College St
- 506 Magnolia Dr
- 511 Richmond Ave
- 1405 Grove Ave
- 1101 Cherokee Dr
- 808 Satilla Blvd
- 301 Riverside Dr
- 310 Butler St
- 924 Highsmith St
- 0 Goodwin St
- 713 Magnolia Dr
- .22 Alice St
- 1504 Habersham Dr
- 511 Riverside Dr
- 707 Euclid Ave
- 0 Saint Marys Dr Unit (TRACT 2 0.25 ACRES)
- 418 Reed St
- 306 Lee Ave