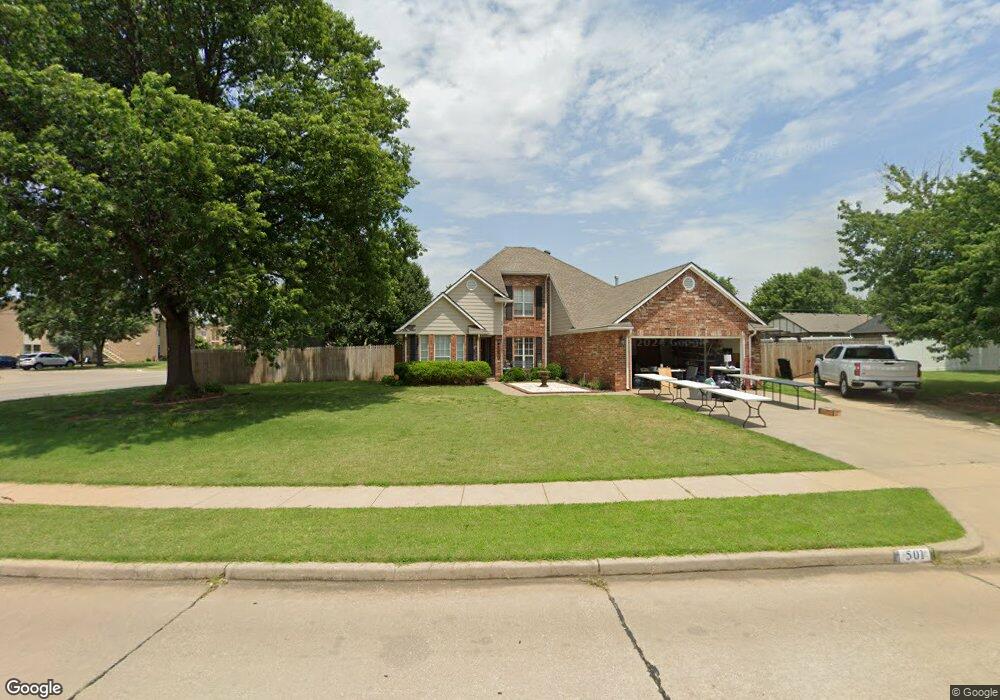
501 Shannon Rd Ponca City, OK 74601
Estimated Value: $223,000 - $237,000
3
Beds
2
Baths
2,067
Sq Ft
$111/Sq Ft
Est. Value
About This Home
This home is located at 501 Shannon Rd, Ponca City, OK 74601 and is currently estimated at $229,265, approximately $110 per square foot. 501 Shannon Rd is a home located in Kay County with nearby schools including Union Elementary School, Ponca City East Middle School, and Ponca City West Middle School.
Ownership History
Date
Name
Owned For
Owner Type
Purchase Details
Closed on
Sep 21, 2018
Sold by
Lybarger Eric T and Lybarger Sarah L
Bought by
Schaefer Justin Lee and Schaefer Jennifer
Current Estimated Value
Home Financials for this Owner
Home Financials are based on the most recent Mortgage that was taken out on this home.
Original Mortgage
$159,493
Outstanding Balance
$139,893
Interest Rate
4.87%
Mortgage Type
FHA
Estimated Equity
$89,372
Purchase Details
Closed on
Jun 1, 2006
Sold by
Christy Katherine Cellne
Bought by
Lybarger Eric T and Lybarger Sarah L
Home Financials for this Owner
Home Financials are based on the most recent Mortgage that was taken out on this home.
Original Mortgage
$150,000
Interest Rate
6.58%
Mortgage Type
New Conventional
Purchase Details
Closed on
Aug 1, 2003
Sold by
Katherine Christy
Bought by
K Christy Rev Lvg Tr
Purchase Details
Closed on
Jul 5, 2002
Sold by
Krystal Chris and Krystal Humble
Bought by
Atherine William and Atherine Christy
Create a Home Valuation Report for This Property
The Home Valuation Report is an in-depth analysis detailing your home's value as well as a comparison with similar homes in the area
Home Values in the Area
Average Home Value in this Area
Purchase History
| Date | Buyer | Sale Price | Title Company |
|---|---|---|---|
| Schaefer Justin Lee | $165,000 | Stewart Escrow & Title | |
| Lybarger Eric T | $150,000 | -- | |
| K Christy Rev Lvg Tr | -- | -- | |
| Atherine William | $130,000 | -- |
Source: Public Records
Mortgage History
| Date | Status | Borrower | Loan Amount |
|---|---|---|---|
| Open | Schaefer Justin Lee | $159,493 | |
| Previous Owner | Lybarger Eric T | $150,000 |
Source: Public Records
Tax History Compared to Growth
Tax History
| Year | Tax Paid | Tax Assessment Tax Assessment Total Assessment is a certain percentage of the fair market value that is determined by local assessors to be the total taxable value of land and additions on the property. | Land | Improvement |
|---|---|---|---|---|
| 2024 | $1,834 | $19,370 | $2,343 | $17,027 |
| 2023 | $1,834 | $18,448 | $2,343 | $16,105 |
| 2022 | $1,672 | $17,569 | $2,343 | $15,226 |
| 2021 | $1,680 | $17,569 | $2,343 | $15,226 |
| 2020 | $1,663 | $17,569 | $2,343 | $15,226 |
| 2019 | $1,681 | $17,592 | $2,343 | $15,249 |
| 2018 | $1,576 | $16,272 | $1,732 | $14,540 |
| 2017 | $1,614 | $16,469 | $1,732 | $14,737 |
| 2016 | $1,650 | $16,665 | $1,732 | $14,933 |
| 2015 | $1,639 | $16,482 | $1,732 | $14,750 |
| 2014 | $1,540 | $15,780 | $1,487 | $14,293 |
Source: Public Records
Map
Nearby Homes
- TBD 5th and Windsor
- 1009 Brentwood Dr
- 120 E Woodbury Rd
- 3651 N 14th St
- 2000 N 5th St
- 2005 N 4th St
- 0000 N Union St
- 3019 Meadow Ln
- 1704 Fairway Place
- 3013 Kingston Rd
- 1703 Leslie Ln
- 3602 N 14th
- 3205 Kingston Rd
- 1128 N 14th St
- 1412 Donahoe Dr
- 304 E Detroit Ave
- 2223 Turner St
- 2117 Ashley Place
- 1600 Monument Rd
- 2023 Turner St
- 509 Shannon Rd
- 500 Shamrock Cir
- 504 Shannon Rd
- 513 Shannon Rd
- 512 Shannon Rd
- 504 Shamrock Cir
- 500 Shannon Rd
- 516 Shannon Rd
- 517 Shannon Rd
- 508 Shamrock Cir
- 501 Shamrock Cir
- 520 Shannon Rd
- 521 Shannon Rd
- 512 Shamrock Cir
- 524 Shannon Rd
- 2527 Windsor Rd
- 505 Shamrock Cir
- 2535 Windsor Rd
- 601 Shannon Rd
- 2519 Windsor Rd