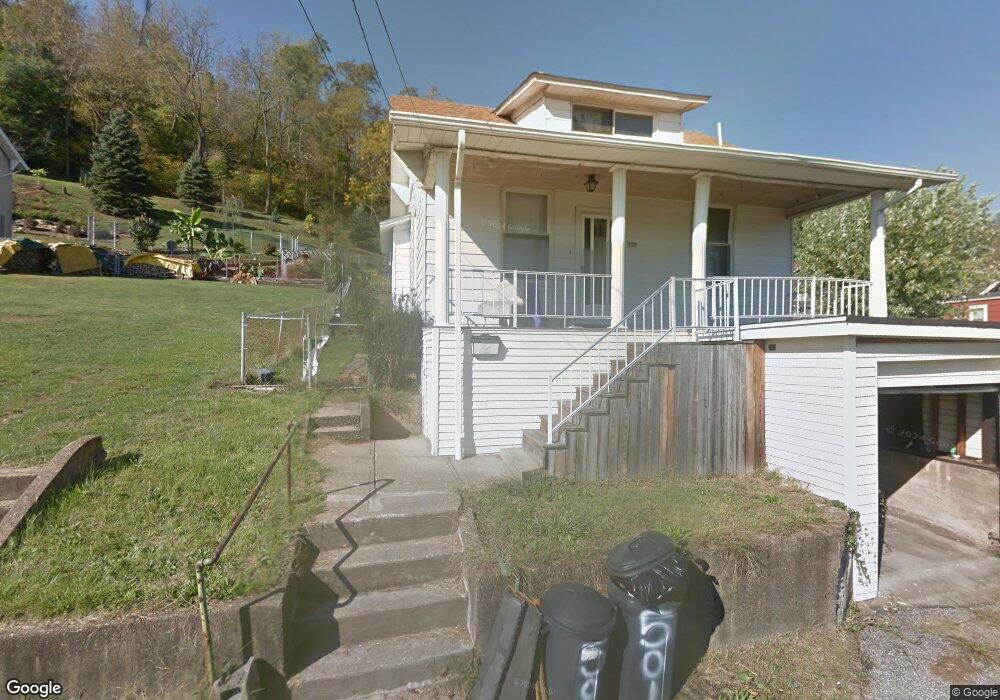
501 Sheets St Martins Ferry, OH 43935
Estimated Value: $52,000 - $124,000
3
Beds
1
Bath
748
Sq Ft
$114/Sq Ft
Est. Value
About This Home
This home is located at 501 Sheets St, Martins Ferry, OH 43935 and is currently estimated at $85,096, approximately $113 per square foot. 501 Sheets St is a home located in Belmont County with nearby schools including Anna Marie Ayers Elementary School, Martins Ferry Middle School, and Martins Ferry High School.
Ownership History
Date
Name
Owned For
Owner Type
Purchase Details
Closed on
Jun 8, 2020
Bought by
M & L Properties Llc
Current Estimated Value
Home Financials for this Owner
Home Financials are based on the most recent Mortgage that was taken out on this home.
Interest Rate
3.18%
Purchase Details
Closed on
May 31, 2018
Bought by
Fryman Joyce A
Home Financials for this Owner
Home Financials are based on the most recent Mortgage that was taken out on this home.
Interest Rate
4.56%
Purchase Details
Closed on
Apr 18, 2001
Sold by
Fryman Frederick P and Fryman Joyc
Bought by
Fryman Frederick P and Fryman Joyc
Purchase Details
Closed on
May 27, 1999
Sold by
Fryman Rosemary A
Bought by
Fryman Rosemary A
Purchase Details
Closed on
Jan 1, 1986
Sold by
Fryman Charles Harry and Fryman Ro
Bought by
Fryman Charles Harry and Fryman Ro
Create a Home Valuation Report for This Property
The Home Valuation Report is an in-depth analysis detailing your home's value as well as a comparison with similar homes in the area
Home Values in the Area
Average Home Value in this Area
Purchase History
| Date | Buyer | Sale Price | Title Company |
|---|---|---|---|
| M & L Properties Llc | $14,500 | -- | |
| Fryman Joyce A | -- | -- | |
| Fryman Frederick P | $27,500 | -- | |
| Fryman Rosemary A | -- | -- | |
| Fryman Charles Harry | -- | -- |
Source: Public Records
Mortgage History
| Date | Status | Borrower | Loan Amount |
|---|---|---|---|
| Closed | M & L Properties Llc | -- | |
| Previous Owner | M & L Properties Llc | -- |
Source: Public Records
Tax History Compared to Growth
Tax History
| Year | Tax Paid | Tax Assessment Tax Assessment Total Assessment is a certain percentage of the fair market value that is determined by local assessors to be the total taxable value of land and additions on the property. | Land | Improvement |
|---|---|---|---|---|
| 2024 | $775 | $18,420 | $2,640 | $15,780 |
| 2023 | $635 | $13,860 | $2,640 | $11,220 |
| 2022 | $635 | $13,857 | $2,639 | $11,218 |
| 2021 | $632 | $13,857 | $2,639 | $11,218 |
| 2020 | $592 | $12,050 | $2,300 | $9,750 |
| 2019 | $595 | $12,050 | $2,300 | $9,750 |
| 2018 | $567 | $12,050 | $2,300 | $9,750 |
| 2017 | $582 | $11,950 | $1,190 | $10,760 |
| 2016 | $587 | $11,950 | $1,190 | $10,760 |
| 2015 | $531 | $11,950 | $1,190 | $10,760 |
| 2014 | $510 | $11,330 | $1,080 | $10,250 |
| 2013 | $479 | $11,330 | $1,080 | $10,250 |
Source: Public Records
Map
Nearby Homes
- 839 W Vine St
- 820 Mariann Dr
- 527 Virginia St
- 805 Indiana St
- 723 Pearl St
- 1020 Virginia St
- 424 Elm St
- 722 Broadway St
- 916 Pearl St
- 1028 Indiana St
- 1027 S Zane Hwy
- 725 S 4th St
- 1836 Colerain Pike
- 0 Ferryview Rd
- 1053 Broadway St
- 513 Union St
- 57365 Washington Blvd
- 910 Carlisle St
- 17 Sunset Dr
- 16 Hillcrest Dr