Estimated Value: $289,000 - $319,000
3
Beds
2
Baths
1,486
Sq Ft
$207/Sq Ft
Est. Value
About This Home
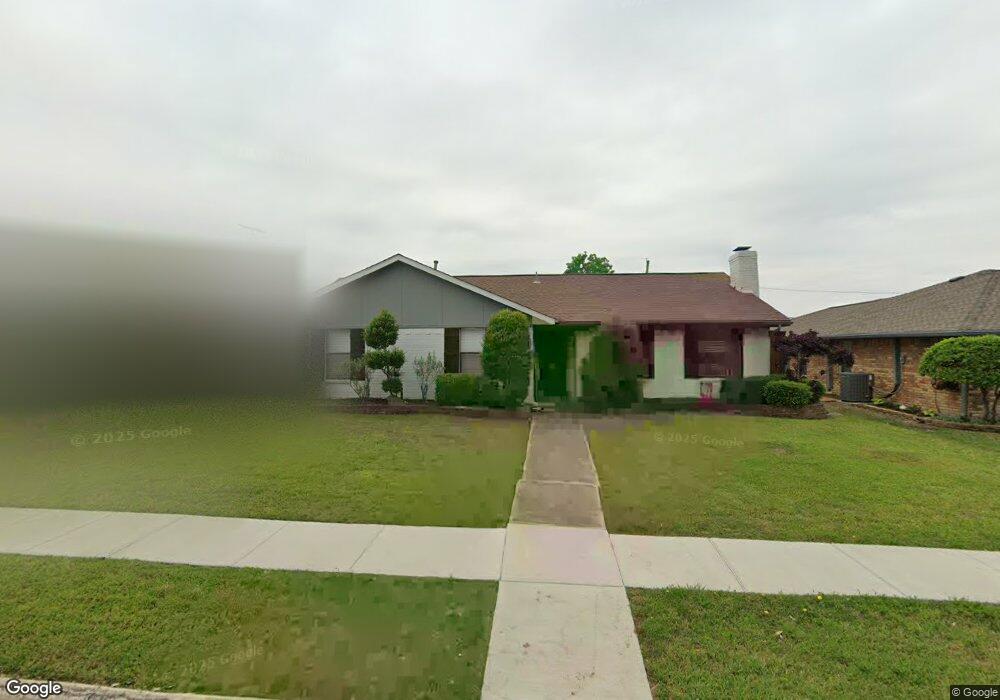
This home is located at 501 Stoneybrook Dr, Wylie, TX 75098 and is currently estimated at $308,308, approximately $207 per square foot. 501 Stoneybrook Dr is a home located in Collin County with nearby schools including R F Hartman Elementary School, AB Harrison Intermediate School, and Grady Burnett J High School.
Ownership History
Date
Name
Owned For
Owner Type
Purchase Details
Closed on
Nov 27, 2019
Sold by
Mcllrath Properties Llc
Bought by
Lenhart Gladys
Current Estimated Value
Home Financials for this Owner
Home Financials are based on the most recent Mortgage that was taken out on this home.
Original Mortgage
$204,232
Outstanding Balance
$178,580
Interest Rate
3.19%
Mortgage Type
FHA
Estimated Equity
$129,728
Purchase Details
Closed on
Aug 15, 2019
Sold by
Bentley George R
Bought by
Mcllrath Properties Llc
Home Financials for this Owner
Home Financials are based on the most recent Mortgage that was taken out on this home.
Original Mortgage
$11,000,000
Interest Rate
3.7%
Mortgage Type
Purchase Money Mortgage
Create a Home Valuation Report for This Property
The Home Valuation Report is an in-depth analysis detailing your home's value as well as a comparison with similar homes in the area
Home Values in the Area
Average Home Value in this Area
Purchase History
| Date | Buyer | Sale Price | Title Company |
|---|---|---|---|
| Lenhart Gladys | -- | None Available | |
| Mcllrath Properties Llc | -- | Chicago Title |
Source: Public Records
Mortgage History
| Date | Status | Borrower | Loan Amount |
|---|---|---|---|
| Open | Lenhart Gladys | $204,232 | |
| Previous Owner | Mcllrath Properties Llc | $11,000,000 |
Source: Public Records
Tax History Compared to Growth
Tax History
| Year | Tax Paid | Tax Assessment Tax Assessment Total Assessment is a certain percentage of the fair market value that is determined by local assessors to be the total taxable value of land and additions on the property. | Land | Improvement |
|---|---|---|---|---|
| 2025 | $4,157 | $307,583 | $75,000 | $232,583 |
| 2024 | $4,157 | $296,152 | $75,000 | $241,578 |
| 2023 | $4,157 | $269,229 | $75,000 | $231,245 |
| 2022 | $5,370 | $244,754 | $75,000 | $220,628 |
| 2021 | $5,235 | $222,504 | $55,000 | $167,504 |
| 2020 | $5,186 | $208,865 | $45,000 | $163,865 |
| 2019 | $4,890 | $186,076 | $45,000 | $141,076 |
| 2018 | $4,969 | $184,529 | $45,000 | $139,529 |
| 2017 | $4,445 | $165,068 | $40,000 | $125,068 |
| 2016 | $3,757 | $135,221 | $25,000 | $110,221 |
| 2015 | $2,981 | $112,671 | $25,000 | $87,671 |
Source: Public Records
Map
Nearby Homes
- 407 Stoneybrook Dr
- 401 Willow Way
- 406 Willow Way
- 603 Valentine Ln
- 307 Memorial Dr
- 612 Willow Way
- 807 Crescent Way
- 1306 Angel Fire Dr
- 708 Stoneybrook Dr
- 205 Stone Cir
- 804 Memorial Dr
- 217 Cloudcroft Dr
- 416 S 1st St
- 702 S Ballard Ave
- 217 Champion
- 206 Covington Dr
- 1706 Asbury Dr
- 212 Colonial Dr
- 203 Forestbrook Dr
- 329 S 2nd St
- 409 Stoneybrook Dr
- 505 Stoneybrook Dr
- 701 Providence Dr
- 507 Stoneybrook Dr
- 405 Stoneybrook Dr
- 408 Stoneybrook Dr
- 500 Stoneybrook Dr
- 406 Stoneybrook Dr
- 502 Stoneybrook Dr
- 703 Providence Dr
- 702 Providence Dr
- 504 Stoneybrook Dr
- 404 Stoneybrook Dr
- 509 Stoneybrook Dr
- 403 Stoneybrook Dr
- 700 Hammond Dr
- 705 Providence Dr
- 702 Hammond
- 402 Stoneybrook Dr
- 506 Stoneybrook Dr