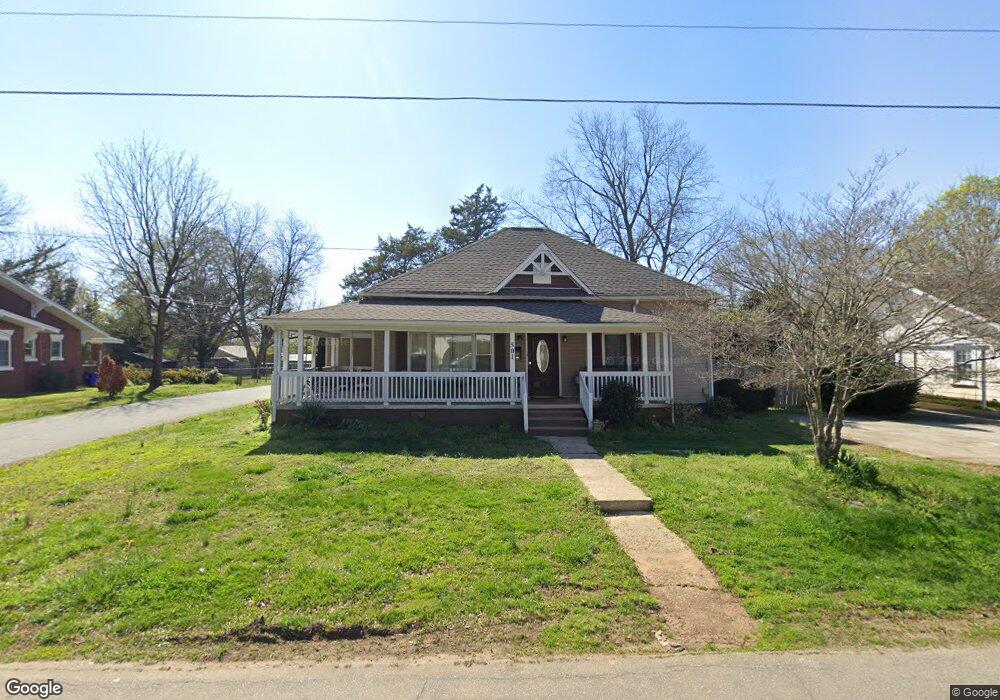
501 W 5th St Siler City, NC 27344
Estimated Value: $232,000 - $279,000
3
Beds
2
Baths
1,646
Sq Ft
$152/Sq Ft
Est. Value
About This Home
This home is located at 501 W 5th St, Siler City, NC 27344 and is currently estimated at $250,460, approximately $152 per square foot. 501 W 5th St is a home located in Chatham County with nearby schools including Siler City Elementary School, Chatham Middle, and Jordan Matthews High.
Ownership History
Date
Name
Owned For
Owner Type
Purchase Details
Closed on
Feb 28, 2023
Sold by
Canales Sandy Alvarez and Canales Manuel
Bought by
Love Chatham
Current Estimated Value
Home Financials for this Owner
Home Financials are based on the most recent Mortgage that was taken out on this home.
Original Mortgage
$217,500
Outstanding Balance
$210,676
Interest Rate
6.33%
Mortgage Type
Seller Take Back
Estimated Equity
$39,784
Purchase Details
Closed on
Nov 22, 2021
Sold by
Hernandez and Manuel
Bought by
Hernandez Antonia Suyapa
Purchase Details
Closed on
Mar 15, 2017
Sold by
First Choice Villas Llc
Bought by
Hernandez Sandy Suyapa Alvarez
Purchase Details
Closed on
Feb 27, 2014
Sold by
Deutsche Bank National Trust Company
Bought by
First Choice Villas Llc
Purchase Details
Closed on
Oct 1, 2013
Sold by
Martin Jerry L and Martin Arlene N
Bought by
Deutsche Bank National Trust Company
Create a Home Valuation Report for This Property
The Home Valuation Report is an in-depth analysis detailing your home's value as well as a comparison with similar homes in the area
Home Values in the Area
Average Home Value in this Area
Purchase History
| Date | Buyer | Sale Price | Title Company |
|---|---|---|---|
| Love Chatham | $237,500 | -- | |
| Love Chatham | $237,500 | None Listed On Document | |
| Hernandez Antonia Suyapa | -- | Atwater W Ben | |
| Hernandez Sandy Suyapa Alvarez | $14,000 | Attorney | |
| First Choice Villas Llc | $29,000 | None Available | |
| Deutsche Bank National Trust Company | $61,000 | None Available |
Source: Public Records
Mortgage History
| Date | Status | Borrower | Loan Amount |
|---|---|---|---|
| Open | Love Chatham | $217,500 | |
| Closed | Love Chatham | $217,500 |
Source: Public Records
Tax History Compared to Growth
Tax History
| Year | Tax Paid | Tax Assessment Tax Assessment Total Assessment is a certain percentage of the fair market value that is determined by local assessors to be the total taxable value of land and additions on the property. | Land | Improvement |
|---|---|---|---|---|
| 2025 | -- | $0 | $0 | $0 |
| 2024 | $1,567 | $123,890 | $9,680 | $114,210 |
| 2023 | $1,493 | $123,890 | $9,680 | $114,210 |
| 2022 | $1,493 | $123,890 | $9,680 | $114,210 |
| 2021 | $1,493 | $123,890 | $9,680 | $114,210 |
| 2020 | $1,291 | $106,668 | $13,530 | $93,138 |
| 2019 | $1,291 | $106,668 | $13,530 | $93,138 |
| 2018 | $1,214 | $106,668 | $13,530 | $93,138 |
| 2017 | $949 | $83,383 | $13,530 | $69,853 |
| 2016 | $1,133 | $101,687 | $16,500 | $85,187 |
| 2015 | $1,120 | $101,687 | $16,500 | $85,187 |
| 2014 | $1,120 | $101,687 | $16,500 | $85,187 |
| 2013 | -- | $101,687 | $16,500 | $85,187 |
Source: Public Records
Map
Nearby Homes
- 803 Woodland Dr
- Tbd W 3rd St
- 519 W Raleigh St
- 806 Cliftwood Dr
- 303 W Dolphin St
- 0 W 3rd St
- 1007 Driftwood Dr
- 1306 Sunset Dr
- 1004 Candlewood Cir
- 1707 N Chatham Ave
- 513 W Glendale St
- 409 E 10th St
- 128 Olde Manor Ct
- 1501 Duet Dr
- TBD E 3rd St
- 701 S Chatham Ave
- 726 S 2nd Ave
- 00 U S Highway 64
- 17880 U S Highway 64
- 254 Pine Forest Dr