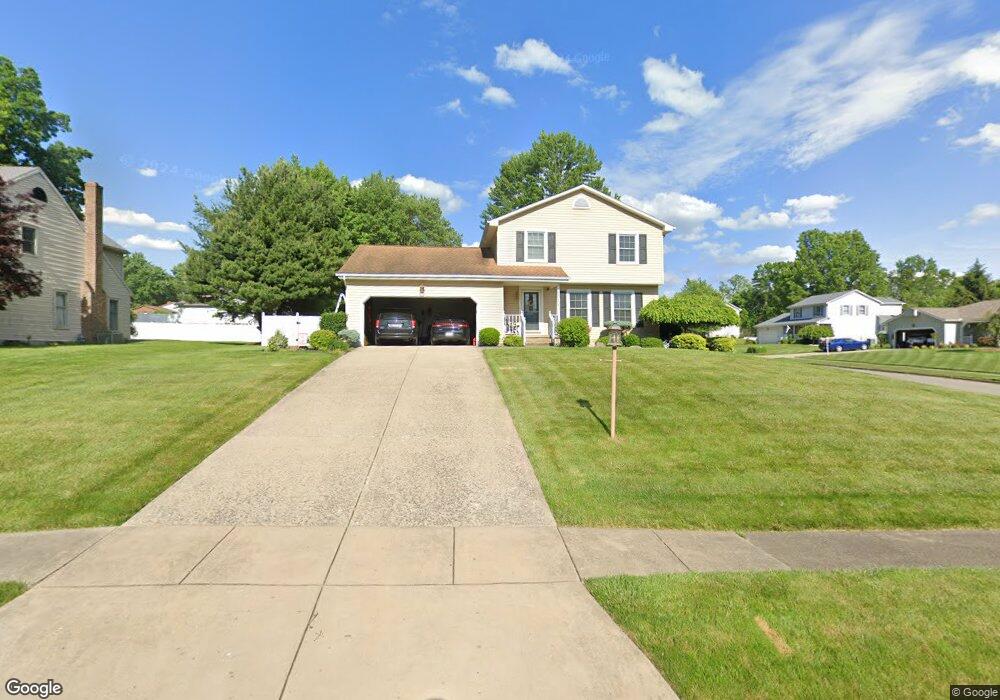
501 W Regency Cir Canfield, OH 44406
Estimated Value: $258,768 - $308,000
3
Beds
2
Baths
1,542
Sq Ft
$184/Sq Ft
Est. Value
About This Home
This home is located at 501 W Regency Cir, Canfield, OH 44406 and is currently estimated at $284,192, approximately $184 per square foot. 501 W Regency Cir is a home located in Mahoning County with nearby schools including Canfield Village Middle School and Canfield High School.
Ownership History
Date
Name
Owned For
Owner Type
Purchase Details
Closed on
May 20, 2005
Sold by
Emerick Jeffrey O and Emerick Hope L
Bought by
Hood Raymond and Hood Carla
Current Estimated Value
Home Financials for this Owner
Home Financials are based on the most recent Mortgage that was taken out on this home.
Original Mortgage
$127,500
Outstanding Balance
$67,459
Interest Rate
6.07%
Mortgage Type
Fannie Mae Freddie Mac
Estimated Equity
$216,733
Purchase Details
Closed on
Apr 24, 2003
Sold by
Kepley Richard L and Kepley Maureen A
Bought by
Emerick Jeffrey O and Emerick Hope L
Home Financials for this Owner
Home Financials are based on the most recent Mortgage that was taken out on this home.
Original Mortgage
$108,720
Interest Rate
5.86%
Purchase Details
Closed on
Aug 15, 1990
Bought by
Kepley Richard L
Create a Home Valuation Report for This Property
The Home Valuation Report is an in-depth analysis detailing your home's value as well as a comparison with similar homes in the area
Home Values in the Area
Average Home Value in this Area
Purchase History
| Date | Buyer | Sale Price | Title Company |
|---|---|---|---|
| Hood Raymond | $150,000 | -- | |
| Emerick Jeffrey O | $135,900 | -- | |
| Kepley Richard L | $12,000 | -- |
Source: Public Records
Mortgage History
| Date | Status | Borrower | Loan Amount |
|---|---|---|---|
| Open | Hood Raymond | $127,500 | |
| Previous Owner | Emerick Jeffrey O | $108,720 | |
| Closed | Emerick Jeffrey O | $20,180 |
Source: Public Records
Tax History Compared to Growth
Tax History
| Year | Tax Paid | Tax Assessment Tax Assessment Total Assessment is a certain percentage of the fair market value that is determined by local assessors to be the total taxable value of land and additions on the property. | Land | Improvement |
|---|---|---|---|---|
| 2024 | $3,144 | $72,930 | $14,350 | $58,580 |
| 2023 | $3,094 | $72,930 | $14,350 | $58,580 |
| 2022 | $3,082 | $57,810 | $12,090 | $45,720 |
| 2021 | $2,991 | $57,810 | $12,090 | $45,720 |
| 2020 | $3,003 | $57,810 | $12,090 | $45,720 |
| 2019 | $2,806 | $49,000 | $10,250 | $38,750 |
| 2018 | $2,771 | $49,000 | $10,250 | $38,750 |
| 2017 | $2,626 | $49,000 | $10,250 | $38,750 |
| 2016 | $2,485 | $44,800 | $10,250 | $34,550 |
| 2015 | $2,430 | $44,800 | $10,250 | $34,550 |
| 2014 | $2,440 | $44,800 | $10,250 | $34,550 |
| 2013 | $2,352 | $44,800 | $10,250 | $34,550 |
Source: Public Records
Map
Nearby Homes
- 510 W Regency Cir
- 90 Villa Theresa Ln
- 80 Villa Theresa Ln
- 91 Villa Theresa Ln
- 81 Villa Theresa Ln
- 71 Villa Theresa Ln
- 61 Villa Theresa Ln
- 51 Villa Theresa Ln
- 30 Villa Theresa Ln
- 41 Villa Theresa Ln
- 20 Villa Theresa Ln
- 31 Villa Theresa Ln
- 52 Lakhani Ln
- 21 Villa Theresa Ln
- 10 Villa Theresa Ln
- 541 Stoneybrook Ln
- 492 Hickory Hollow Dr
- 395 N Broad St
- 218 Moreland Dr
- 675 Blueberry Hill Dr
- 511 W Regency Cir
- 500 E Regency Cir
- 510 E Regency Cir
- 81 Sawmill Run Dr
- 500 W Regency Cir
- 91 Sawmill Run Dr
- 521 W Regency Cir
- 71 Sawmill Run Dr
- 101 Sawmill Run Dr
- 520 E Regency Cir
- 520 W Regency Cir
- 61 Sawmill Run Dr
- 111 Sawmill Run Dr
- 531 W Regency Cir
- 501 E Regency Cir
- 501 Woodbury Ct
- 530 E Regency Cir
- 530 W Regency Cir
- 511 Woodbury Ct
- 121 Willow Way