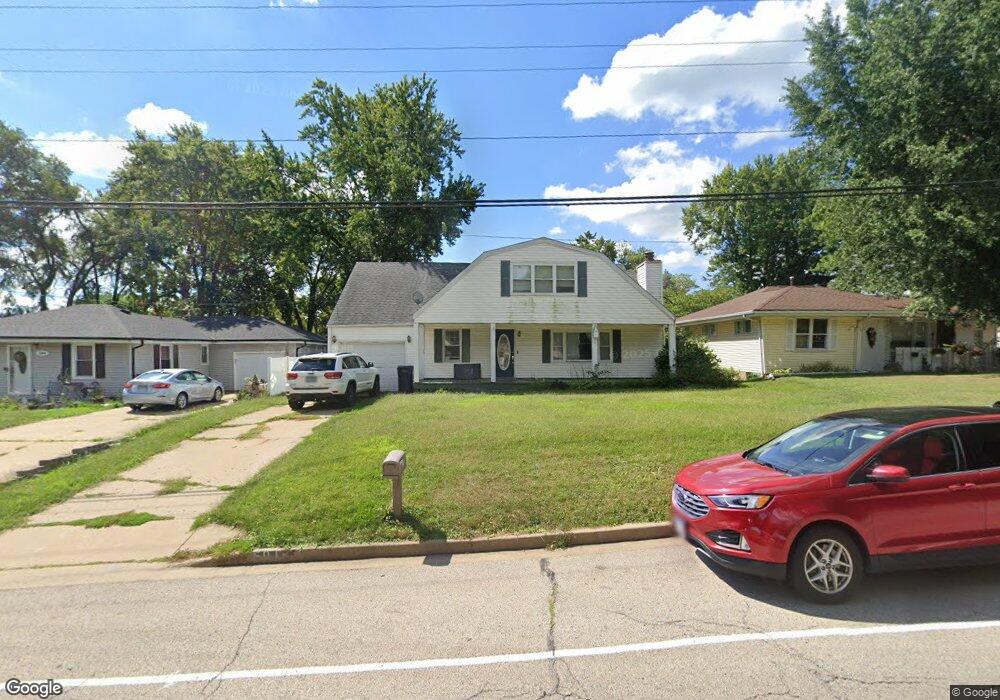
5010 Pfeiffer Rd Peoria, IL 61607
Estimated Value: $150,000 - $163,000
3
Beds
2
Baths
1,800
Sq Ft
$88/Sq Ft
Est. Value
About This Home
This home is located at 5010 Pfeiffer Rd, Peoria, IL 61607 and is currently estimated at $158,451, approximately $88 per square foot. 5010 Pfeiffer Rd is a home located in Peoria County with nearby schools including Oak Grove School, Oak Grove West School, and Limestone Community High School.
Ownership History
Date
Name
Owned For
Owner Type
Purchase Details
Closed on
Jan 30, 2024
Sold by
Klingel Emily R and Klingel Casondra L
Bought by
Burtsfield Austin
Current Estimated Value
Home Financials for this Owner
Home Financials are based on the most recent Mortgage that was taken out on this home.
Original Mortgage
$134,411
Outstanding Balance
$132,097
Interest Rate
6.75%
Mortgage Type
FHA
Estimated Equity
$26,354
Purchase Details
Closed on
Nov 30, 2022
Sold by
Roberts Randy E and Roberts Shannon
Bought by
Klingel Emily R and Shaw Casondra L
Home Financials for this Owner
Home Financials are based on the most recent Mortgage that was taken out on this home.
Original Mortgage
$122,735
Interest Rate
6.95%
Mortgage Type
FHA
Purchase Details
Closed on
Sep 1, 2005
Bought by
Roberts Randy E and Roberts Shannon
Create a Home Valuation Report for This Property
The Home Valuation Report is an in-depth analysis detailing your home's value as well as a comparison with similar homes in the area
Home Values in the Area
Average Home Value in this Area
Purchase History
| Date | Buyer | Sale Price | Title Company |
|---|---|---|---|
| Burtsfield Austin | -- | None Listed On Document | |
| Klingel Emily R | $125,000 | -- | |
| Roberts Randy E | $120,000 | -- |
Source: Public Records
Mortgage History
| Date | Status | Borrower | Loan Amount |
|---|---|---|---|
| Open | Burtsfield Austin | $134,411 | |
| Previous Owner | Klingel Emily R | $122,735 |
Source: Public Records
Tax History
| Year | Tax Paid | Tax Assessment Tax Assessment Total Assessment is a certain percentage of the fair market value that is determined by local assessors to be the total taxable value of land and additions on the property. | Land | Improvement |
|---|---|---|---|---|
| 2024 | $4,817 | $49,250 | $6,650 | $42,600 |
| 2023 | $4,543 | $45,600 | $6,160 | $39,440 |
| 2022 | $4,375 | $43,280 | $5,810 | $37,470 |
| 2021 | $4,231 | $41,620 | $5,590 | $36,030 |
| 2020 | $4,009 | $40,800 | $5,480 | $35,320 |
| 2019 | $3,997 | $40,800 | $5,480 | $35,320 |
| 2018 | $3,906 | $40,780 | $5,470 | $35,310 |
| 2017 | $4,046 | $41,200 | $5,530 | $35,670 |
| 2016 | $4,073 | $41,620 | $5,590 | $36,030 |
Source: Public Records
Map
Nearby Homes
- 5108 W Pfeiffer Rd
- 4506 Baker Ln
- 4119 Fairview Dr
- 3908 Lauder Ave
- 4609 W Whipp Ave
- 3819 S Paramount Rd
- 32 Caliente Ave
- 11 Waibel Rd
- 15 Sandalwood Ln
- 111 N Sanderson Ave
- 605 Franklin Ave
- 601 Franklin Ave
- 203 Eaton Ave
- 4202 W Smithville Rd
- 7105 Depot St
- 2715 S Tiara Strip
- 5913 Madison St
- 5914 Madison St
- 5914 S Jefferson St
- 117 Hill St
- 5010 W Pfeiffer Rd
- 5008 Pfeiffer Rd
- 5012 Pfeiffer Rd
- 5016 Pfeiffer Rd
- 5006 W Pfeiffer Rd
- 5006 Pfeiffer Rd
- 17 Rutledge Ave
- 15 Rutledge Ave
- 19 Rutledge Ave
- 5020 Pfeiffer Rd
- 4930 Pfeiffer Rd
- 13 Rutledge Ave
- 21 Rutledge Ave
- 5024 Pfeiffer Rd
- 5011 Pfeiffer Rd
- 5009 Pfeiffer Rd
- 5024 W Pfeiffer Rd
- 5017 Pfeiffer Rd
- 23 Rutledge Ave
- 5023 Pfeiffer Rd
Your Personal Tour Guide
Ask me questions while you tour the home.