Estimated Value: $454,304 - $521,000
5
Beds
3
Baths
2,823
Sq Ft
$168/Sq Ft
Est. Value
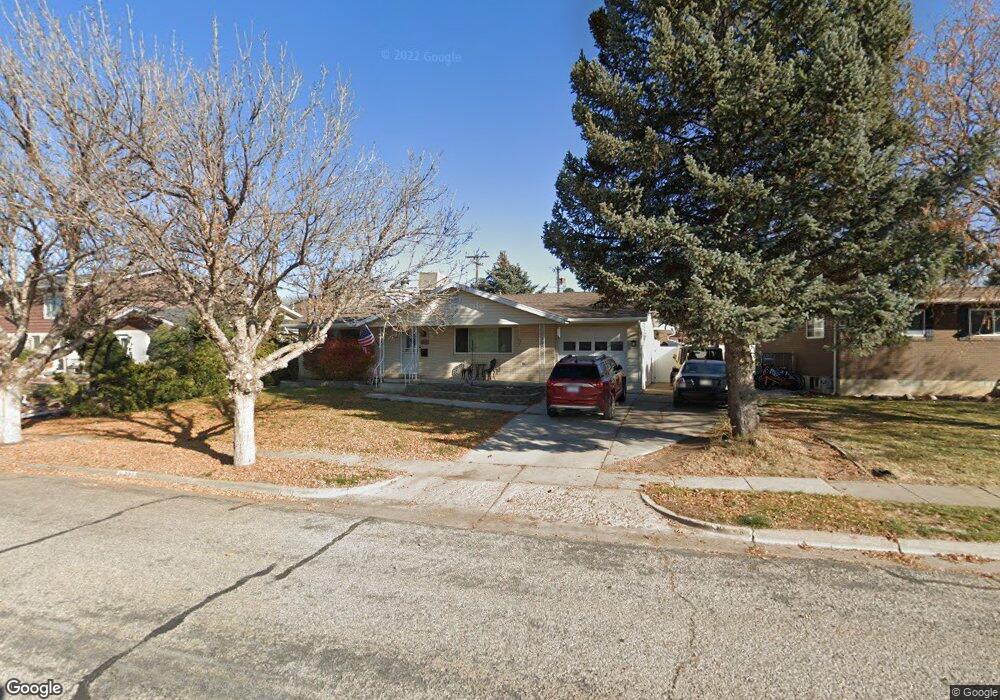
About This Home
This home is located at 5010 S 2600 W, Roy, UT 84067 and is currently estimated at $473,326, approximately $167 per square foot. 5010 S 2600 W is a home located in Weber County with nearby schools including Lakeview Elementary School, Roy Junior High School, and Roy High School.
Ownership History
Date
Name
Owned For
Owner Type
Purchase Details
Closed on
Jun 27, 2018
Sold by
Hayes Zachary J
Bought by
Call Jennifer B
Current Estimated Value
Purchase Details
Closed on
Dec 30, 2008
Sold by
Hayes Grant and Hayes Denise
Bought by
Hayes Jennifer B and Hayes Zachary J
Home Financials for this Owner
Home Financials are based on the most recent Mortgage that was taken out on this home.
Original Mortgage
$178,642
Interest Rate
6.03%
Mortgage Type
FHA
Purchase Details
Closed on
Dec 9, 2004
Sold by
Mckinstry Robert E and Mckinstry Julie A
Bought by
Hayes Grant and Hayes Denise
Create a Home Valuation Report for This Property
The Home Valuation Report is an in-depth analysis detailing your home's value as well as a comparison with similar homes in the area
Home Values in the Area
Average Home Value in this Area
Purchase History
| Date | Buyer | Sale Price | Title Company |
|---|---|---|---|
| Call Jennifer B | -- | Inwest Title Services Inc | |
| Hayes Jennifer B | -- | Bonneville Superior Title Co | |
| Hayes Grant | -- | First American Title |
Source: Public Records
Mortgage History
| Date | Status | Borrower | Loan Amount |
|---|---|---|---|
| Previous Owner | Hayes Jennifer B | $178,642 |
Source: Public Records
Tax History
| Year | Tax Paid | Tax Assessment Tax Assessment Total Assessment is a certain percentage of the fair market value that is determined by local assessors to be the total taxable value of land and additions on the property. | Land | Improvement |
|---|---|---|---|---|
| 2025 | $2,724 | $433,757 | $115,672 | $318,085 |
| 2024 | $2,398 | $234,299 | $63,620 | $170,679 |
| 2023 | $2,203 | $215,600 | $61,354 | $154,246 |
| 2022 | $2,565 | $255,750 | $53,792 | $201,958 |
| 2021 | $2,014 | $333,000 | $68,071 | $264,929 |
| 2020 | $1,882 | $285,000 | $68,071 | $216,929 |
| 2019 | $1,846 | $264,000 | $40,016 | $223,984 |
| 2018 | $1,724 | $233,000 | $36,015 | $196,985 |
| 2017 | $1,715 | $218,428 | $36,015 | $182,413 |
| 2016 | $1,550 | $106,440 | $18,525 | $87,915 |
| 2015 | $1,331 | $94,192 | $15,708 | $78,484 |
| 2014 | $1,330 | $93,094 | $15,708 | $77,386 |
Source: Public Records
Map
Nearby Homes
- 5125 S 2600 W
- 2466 W 5075 S
- 2402 W 5075 S
- 5249 S 2500 W
- 4881 S 2400 W
- 5063 S 2825 W
- 2872 W 5000 S
- 5301 S 2675 W
- 4891 S 2875 W
- 5273 S 2800 W Unit 2A
- 283 3800 S 1900 W #283 Unit 283
- 5243 S 2200 W
- 5261 S 2200 W
- 2602 W 4600 S
- 5289 S 2200 W
- 4793 S 3025 W
- 5185 S 2100 W
- 5376 S 2200 W
- 5427 S 2200 W
- 3004 W 4650 S
Your Personal Tour Guide
Ask me questions while you tour the home.