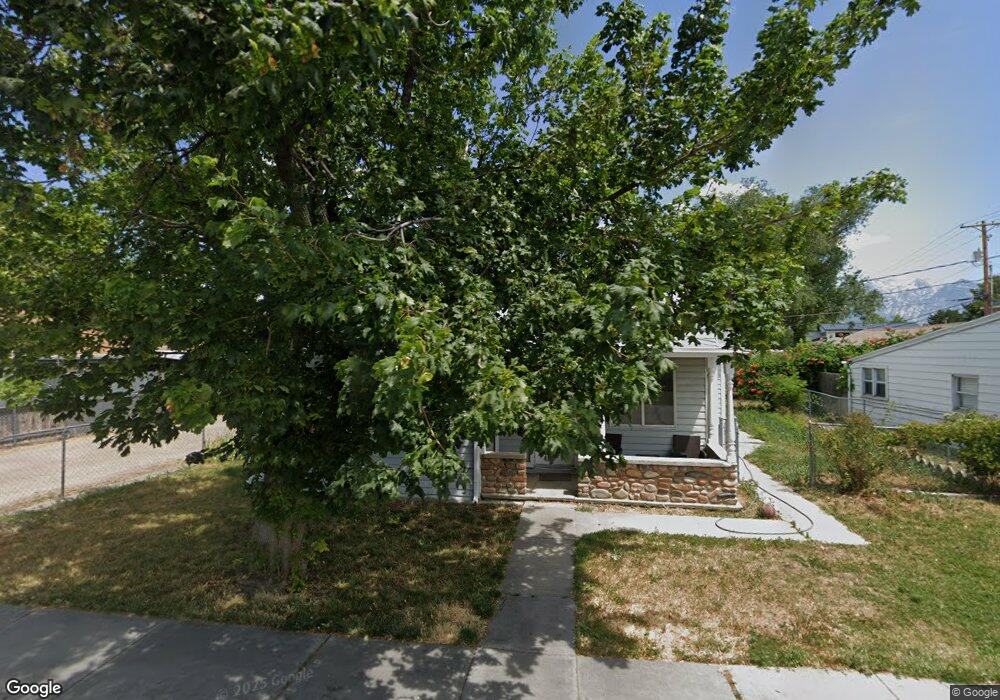
5011 Glenn St Salt Lake City, UT 84107
Estimated Value: $452,074 - $475,000
3
Beds
2
Baths
1,228
Sq Ft
$377/Sq Ft
Est. Value
About This Home
This home is located at 5011 Glenn St, Salt Lake City, UT 84107 and is currently estimated at $463,019, approximately $377 per square foot. 5011 Glenn St is a home located in Salt Lake County with nearby schools including Parkside Elementary School, Hillcrest Junior High School, and Murray High School.
Ownership History
Date
Name
Owned For
Owner Type
Purchase Details
Closed on
Feb 9, 2009
Sold by
Crocker Billie
Bought by
Glen Street Lc
Current Estimated Value
Purchase Details
Closed on
Apr 10, 2008
Sold by
Crocker Billie
Bought by
Glen Street Lc
Purchase Details
Closed on
Aug 11, 2006
Sold by
Glen Street Lc
Bought by
Crocker Billie
Purchase Details
Closed on
Mar 20, 2003
Sold by
Crocker Shirley C
Bought by
Glen Street Lc
Purchase Details
Closed on
Jan 15, 2003
Sold by
Crocker Billie
Bought by
Crocker Shirley C and Billie Elaine Crocker Family Living Tr
Purchase Details
Closed on
Oct 17, 2002
Sold by
Glen Street Lc
Bought by
Crocker Billie
Purchase Details
Closed on
Sep 30, 2002
Sold by
Mcarthur Brian
Bought by
Glen Street Lc
Purchase Details
Closed on
Sep 19, 2002
Sold by
Hoffman Peter T and Hoffman Arlene R
Bought by
Mcarthur Brian
Create a Home Valuation Report for This Property
The Home Valuation Report is an in-depth analysis detailing your home's value as well as a comparison with similar homes in the area
Home Values in the Area
Average Home Value in this Area
Purchase History
| Date | Buyer | Sale Price | Title Company |
|---|---|---|---|
| Glen Street Lc | -- | None Available | |
| Glen Street Lc | -- | Township Title | |
| Crocker Billie | -- | None Available | |
| Glen Street Lc | -- | City Title | |
| Crocker Shirley C | -- | City Title | |
| Crocker Billie | -- | City Title | |
| Glen Street Lc | -- | City Title | |
| Mcarthur Brian | -- | United Title Services |
Source: Public Records
Tax History Compared to Growth
Tax History
| Year | Tax Paid | Tax Assessment Tax Assessment Total Assessment is a certain percentage of the fair market value that is determined by local assessors to be the total taxable value of land and additions on the property. | Land | Improvement |
|---|---|---|---|---|
| 2025 | $1,290 | $329,000 | $136,500 | $192,500 |
| 2024 | $1,290 | $286,200 | $129,200 | $157,000 |
| 2023 | $1,206 | $256,200 | $124,200 | $132,000 |
| 2022 | $1,301 | $262,800 | $121,800 | $141,000 |
| 2021 | $1,148 | $204,500 | $93,300 | $111,200 |
| 2020 | $1,137 | $191,700 | $83,300 | $108,400 |
| 2019 | $1,153 | $187,700 | $78,600 | $109,100 |
| 2018 | $978 | $162,500 | $78,600 | $83,900 |
| 2017 | $920 | $154,200 | $78,600 | $75,600 |
| 2016 | $923 | $149,300 | $75,600 | $73,700 |
| 2015 | $941 | $138,200 | $62,300 | $75,900 |
| 2014 | $891 | $129,800 | $61,000 | $68,800 |
Source: Public Records
Map
Nearby Homes
- 313 Elm St
- 469 E Vine St
- 155 E Vine St
- 149 E Vine St
- 496 E Spruce Glen Rd
- 436 Moss Creek Dr
- 700 E Spruce Glen Rd
- 4757 S Meadowview Rd
- 622 Lincoln Place
- 4760 S Millrace Ln
- 599 E Savvy Cove S Unit 44
- 424 Shamrock Dr
- 576 E Vine St Unit 3B
- 5313 Alpine Dr
- 5130 Caribbean Way
- 4600 S Creekview Dr
- 4913 S Naylor Ln
- 4913 S Naylor Ln Unit 2
- 415 E Creekside Cir Unit B
- 4641 S Rainbow Dr