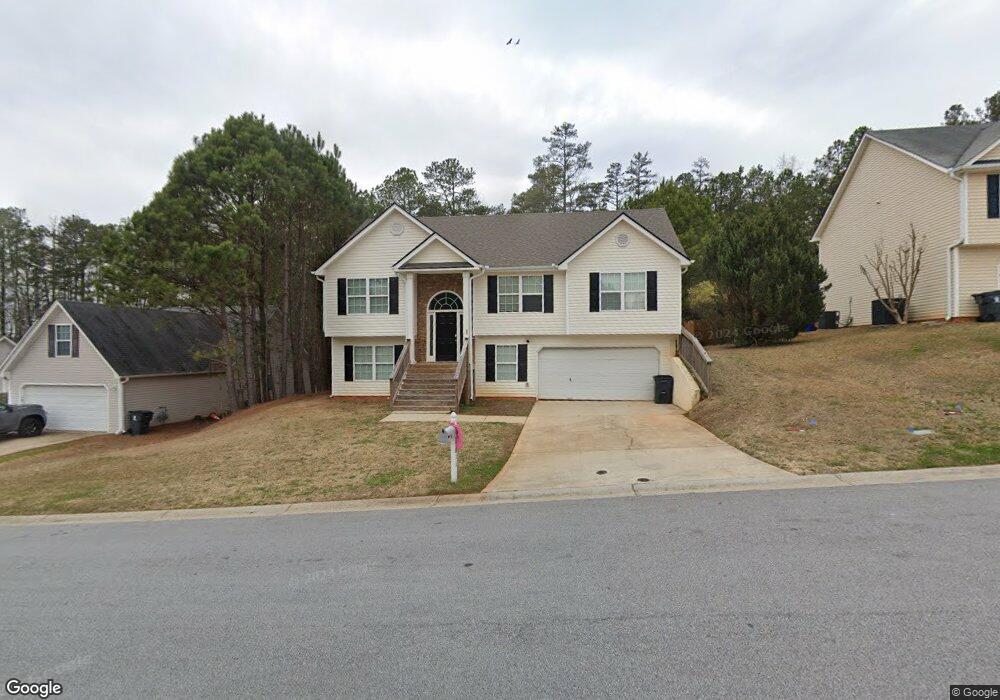
5011 Grist Mill Dr Unit 7 Villa Rica, GA 30180
Estimated Value: $290,555 - $296,000
5
Beds
3
Baths
1,596
Sq Ft
$184/Sq Ft
Est. Value
About This Home
This home is located at 5011 Grist Mill Dr Unit 7, Villa Rica, GA 30180 and is currently estimated at $293,389, approximately $183 per square foot. 5011 Grist Mill Dr Unit 7 is a home located in Douglas County with nearby schools including Mason Creek Elementary School, Mason Creek Middle School, and Alexander High School.
Ownership History
Date
Name
Owned For
Owner Type
Purchase Details
Closed on
Sep 5, 2024
Sold by
Sfr Javelin Borrower Lp and 2024-1 Ih Borrower Lp
Bought by
2024-1 Ih Borrower Lp
Current Estimated Value
Home Financials for this Owner
Home Financials are based on the most recent Mortgage that was taken out on this home.
Original Mortgage
$891,909,000
Outstanding Balance
$736,633,245
Interest Rate
6.73%
Mortgage Type
New Conventional
Estimated Equity
-$736,339,856
Purchase Details
Closed on
Aug 2, 2021
Sold by
Winrow Christopher L
Bought by
Sfr Javelin Borrower Lp
Purchase Details
Closed on
Aug 31, 2016
Sold by
Tiffany
Bought by
Winrow Christopher L
Home Financials for this Owner
Home Financials are based on the most recent Mortgage that was taken out on this home.
Original Mortgage
$146,055
Interest Rate
3.87%
Mortgage Type
FHA
Create a Home Valuation Report for This Property
The Home Valuation Report is an in-depth analysis detailing your home's value as well as a comparison with similar homes in the area
Home Values in the Area
Average Home Value in this Area
Purchase History
| Date | Buyer | Sale Price | Title Company |
|---|---|---|---|
| 2024-1 Ih Borrower Lp | -- | None Listed On Document | |
| 2024-1 Ih Borrower Lp | -- | None Listed On Document | |
| Sfr Javelin Borrower Lp | $235,000 | -- | |
| Winrow Christopher L | $148,750 | -- |
Source: Public Records
Mortgage History
| Date | Status | Borrower | Loan Amount |
|---|---|---|---|
| Open | 2024-1 Ih Borrower Lp | $891,909,000 | |
| Closed | 2024-1 Ih Borrower Lp | $891,909,000 | |
| Previous Owner | Winrow Christopher L | $146,055 |
Source: Public Records
Tax History Compared to Growth
Tax History
| Year | Tax Paid | Tax Assessment Tax Assessment Total Assessment is a certain percentage of the fair market value that is determined by local assessors to be the total taxable value of land and additions on the property. | Land | Improvement |
|---|---|---|---|---|
| 2024 | $3,723 | $100,480 | $20,000 | $80,480 |
| 2023 | $3,723 | $95,560 | $14,000 | $81,560 |
| 2022 | $3,648 | $94,840 | $14,000 | $80,840 |
| 2021 | $2,531 | $71,600 | $12,600 | $59,000 |
| 2020 | $2,570 | $71,600 | $12,600 | $59,000 |
| 2019 | $2,299 | $67,760 | $12,600 | $55,160 |
| 2018 | $2,287 | $66,160 | $12,600 | $53,560 |
| 2017 | $2,159 | $59,720 | $12,600 | $47,120 |
| 2016 | $2,295 | $59,200 | $12,880 | $46,320 |
| 2015 | $1,432 | $38,360 | $9,520 | $28,840 |
| 2014 | $1,432 | $35,600 | $9,520 | $26,080 |
| 2013 | -- | $33,440 | $8,960 | $24,480 |
Source: Public Records
Map
Nearby Homes
- 3395 Laurel Springs Cove
- 3450 Laurel Springs Cove
- 166 Millwheel Dr
- 3405 Cascade Trail
- 106 Rocky Branch Way
- 102 Rocky Branch Way
- 3395 Woodlake Ln
- 9720 Poole Rd
- 219 Millwheel Dr
- 3425 Lake Breeze Ct
- 9427 Poole Rd
- 3657 Liberty Rd
- 3545 Liberty Rd
- 222 Bastian Dr Unit 115
- 222 Bastian Dr
- 210 Villa Rica Springs
- 401 Bass Cir
- 217 Bastian Dr Unit 8
- 233 Bastian Dr Unit 16
- 114 Crooked Lake Park
- 5011 Grist Mill Dr
- 5013 Grist Mill Dr
- 5009 Grist Mill Dr
- 5009 Grist Mill Dr
- 521 Grist Mill Dr
- 0 Grist Mill Dr Unit 7450469
- 0 Grist Mill Dr Unit 7503524
- 0 Grist Mill Dr Unit 7411561
- 0 Grist Mill Dr Unit 7078617
- 0 Grist Mill Dr Unit 8958158
- 0 Grist Mill Dr Unit 8734563
- 0 Grist Mill Dr
- 5015 Grist Mill Dr
- 5007 Grist Mill Dr Unit 5
- 5007 Grist Mill Dr
- 5012 Grist Mill Dr
- 5014 Grist Mill Dr
- 5008 Grist Mill Dr
- 5008 Grist Mill Dr
- 5017 Grist Mill Dr