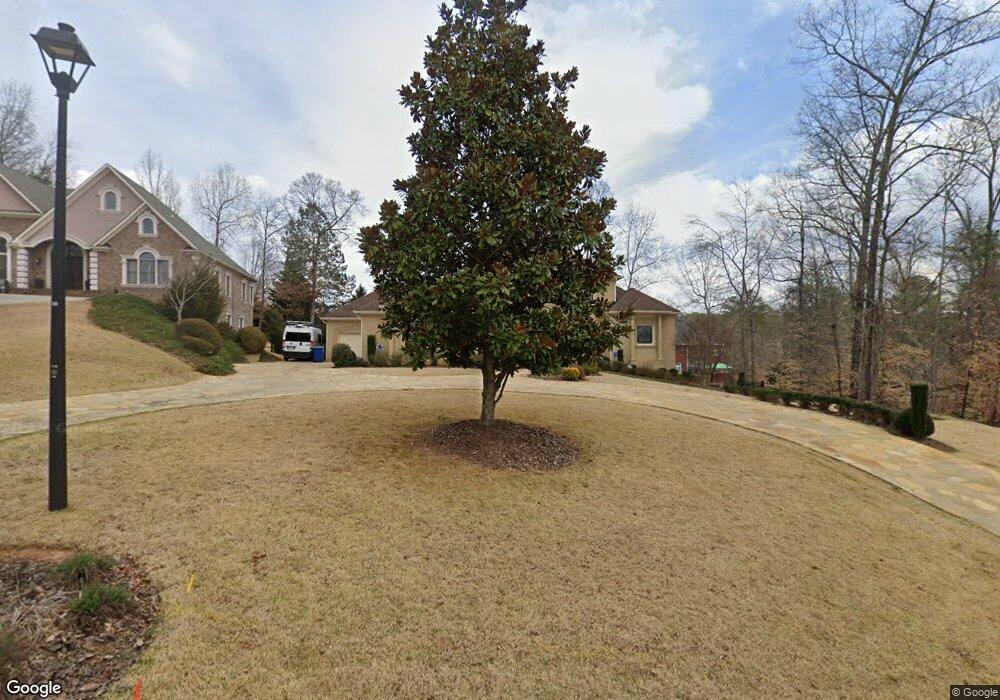
5012 Colton Run Atlanta, GA 30349
Estimated Value: $767,175 - $841,000
6
Beds
8
Baths
6,003
Sq Ft
$134/Sq Ft
Est. Value
About This Home
This home is located at 5012 Colton Run, Atlanta, GA 30349 and is currently estimated at $805,544, approximately $134 per square foot. 5012 Colton Run is a home located in Fulton County with nearby schools including Wolf Creek Elementary, Sandtown Middle School, and Westlake High School.
Ownership History
Date
Name
Owned For
Owner Type
Purchase Details
Closed on
Jul 21, 2020
Sold by
Henry Shirley Langley
Bought by
Waters John Isaac
Current Estimated Value
Home Financials for this Owner
Home Financials are based on the most recent Mortgage that was taken out on this home.
Original Mortgage
$510,400
Outstanding Balance
$452,589
Interest Rate
3.1%
Mortgage Type
New Conventional
Estimated Equity
$352,955
Purchase Details
Closed on
Dec 2, 2012
Sold by
Langley Shirley A
Bought by
Henry Shirley Langley and Henry Charles Darrell
Purchase Details
Closed on
Oct 31, 2007
Sold by
Knc & A Properties Inc
Bought by
Langley Shirley A
Home Financials for this Owner
Home Financials are based on the most recent Mortgage that was taken out on this home.
Original Mortgage
$417,000
Interest Rate
6.27%
Mortgage Type
New Conventional
Create a Home Valuation Report for This Property
The Home Valuation Report is an in-depth analysis detailing your home's value as well as a comparison with similar homes in the area
Home Values in the Area
Average Home Value in this Area
Purchase History
| Date | Buyer | Sale Price | Title Company |
|---|---|---|---|
| Waters John Isaac | $569,750 | -- | |
| Henry Shirley Langley | -- | -- | |
| Langley Shirley A | $670,400 | -- |
Source: Public Records
Mortgage History
| Date | Status | Borrower | Loan Amount |
|---|---|---|---|
| Open | Waters John Isaac | $510,400 | |
| Previous Owner | Langley Shirley A | $417,000 |
Source: Public Records
Tax History Compared to Growth
Tax History
| Year | Tax Paid | Tax Assessment Tax Assessment Total Assessment is a certain percentage of the fair market value that is determined by local assessors to be the total taxable value of land and additions on the property. | Land | Improvement |
|---|---|---|---|---|
| 2025 | $9,972 | $258,880 | $50,200 | $208,680 |
| 2023 | $7,307 | $258,880 | $50,200 | $208,680 |
| 2022 | $8,486 | $216,440 | $18,880 | $197,560 |
| 2021 | $8,412 | $210,160 | $18,320 | $191,840 |
| 2020 | $4,638 | $144,520 | $18,120 | $126,400 |
| 2019 | $4,302 | $126,240 | $15,640 | $110,600 |
| 2018 | $4,218 | $123,280 | $15,280 | $108,000 |
| 2017 | $4,232 | $120,920 | $7,960 | $112,960 |
| 2016 | $4,231 | $120,920 | $7,960 | $112,960 |
| 2015 | $4,244 | $120,920 | $7,960 | $112,960 |
| 2014 | $4,450 | $120,920 | $7,960 | $112,960 |
Source: Public Records
Map
Nearby Homes
- 4825 Neal Ridge
- 239 Amy Overlook
- 4826 Neal Ridge Unit 36
- 4826 Neal Ridge
- 4821 Neal Ridge
- 4814 Neal Ridge
- 4837 Neal Ridge
- 512 Fortner Ln
- 4257 Colton Park
- 4855 Canyon Lake Dr
- 0 Hawkins Crossing Unit 10524727
- 4995 Greentree Trail
- 993 Jordan Way
- 4844 Wolfcreek View
- 310 Wolfcreek Cove
- 150 Old Fairburn Close SW
- 4955 Highland Lake Dr
- 140 Old Fairburn Close SW
- 3895 Old Fairburn Rd SW
- 5008 Colton Run
- 4735 Jailette Trace
- 4730 Jailette Trace
- 5003 Colton Run
- 4725 Jailette Trace
- 5007 Colton Run
- 4720 Jailette Trace
- 4240 Glad Morning Dr
- 334 Amy Way
- 5027 Colton Run
- 4200 Central Park Place
- 4715 Jailette Trace
- 344 Amy Way
- 5024 Colton Run
- 324 Amy Way
- 4710 Jailette Trace
- 4215 Glad Morning Dr
- 4230 Glad Morning Dr
- 4700 Jailette Trace
- 4195 Central Park Place