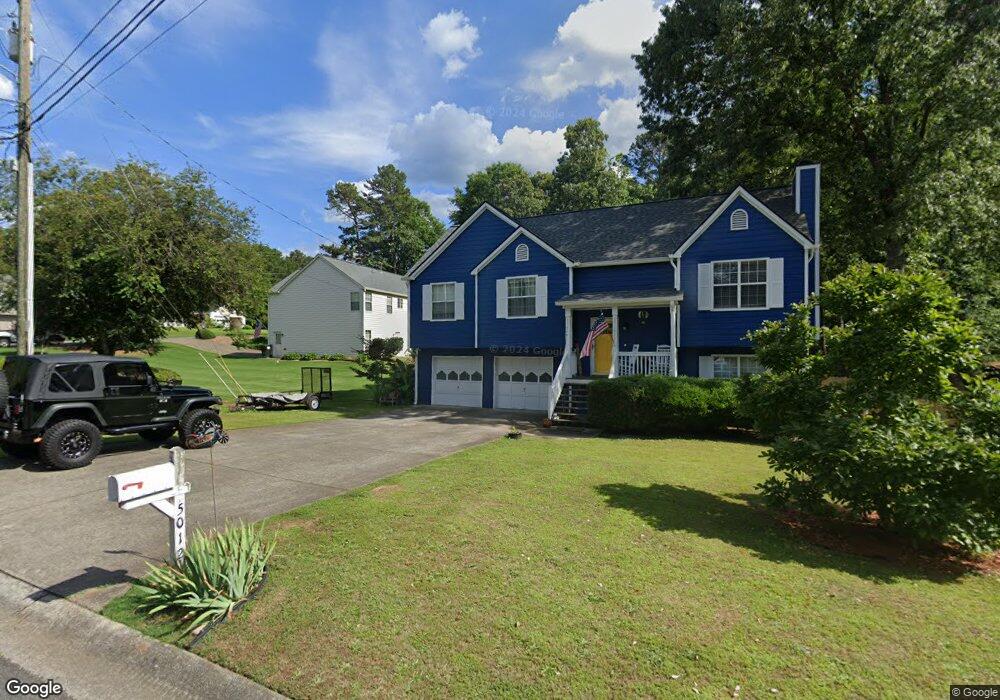
5012 River Rock Way Unit 6 Woodstock, GA 30188
Union Hill NeighborhoodEstimated Value: $396,000 - $413,441
3
Beds
2
Baths
1,986
Sq Ft
$204/Sq Ft
Est. Value
About This Home
This home is located at 5012 River Rock Way Unit 6, Woodstock, GA 30188 and is currently estimated at $404,721, approximately $203 per square foot. 5012 River Rock Way Unit 6 is a home located in Cherokee County with nearby schools including Arnold Mill Elementary School, Mill Creek Middle School, and River Ridge High School.
Ownership History
Date
Name
Owned For
Owner Type
Purchase Details
Closed on
May 18, 2015
Sold by
Ward Kevin Daniel
Bought by
Pilcher Janice
Current Estimated Value
Home Financials for this Owner
Home Financials are based on the most recent Mortgage that was taken out on this home.
Original Mortgage
$158,083
Outstanding Balance
$121,739
Interest Rate
3.75%
Mortgage Type
FHA
Estimated Equity
$282,982
Purchase Details
Closed on
Aug 25, 2004
Sold by
Sullivan Nrian K
Bought by
Ward Kevin D
Home Financials for this Owner
Home Financials are based on the most recent Mortgage that was taken out on this home.
Original Mortgage
$145,000
Interest Rate
5.91%
Mortgage Type
New Conventional
Purchase Details
Closed on
Jul 19, 1993
Sold by
Colony Homes Lp
Bought by
Sullivan Brian K
Home Financials for this Owner
Home Financials are based on the most recent Mortgage that was taken out on this home.
Original Mortgage
$71,900
Interest Rate
7.26%
Create a Home Valuation Report for This Property
The Home Valuation Report is an in-depth analysis detailing your home's value as well as a comparison with similar homes in the area
Home Values in the Area
Average Home Value in this Area
Purchase History
| Date | Buyer | Sale Price | Title Company |
|---|---|---|---|
| Pilcher Janice | $161,000 | -- | |
| Ward Kevin D | $152,700 | -- | |
| Sullivan Brian K | $93,000 | -- |
Source: Public Records
Mortgage History
| Date | Status | Borrower | Loan Amount |
|---|---|---|---|
| Open | Pilcher Janice | $158,083 | |
| Previous Owner | Ward Kevin D | $145,000 | |
| Previous Owner | Sullivan Brian K | $71,900 |
Source: Public Records
Tax History Compared to Growth
Tax History
| Year | Tax Paid | Tax Assessment Tax Assessment Total Assessment is a certain percentage of the fair market value that is determined by local assessors to be the total taxable value of land and additions on the property. | Land | Improvement |
|---|---|---|---|---|
| 2025 | $3,695 | $161,020 | $32,000 | $129,020 |
| 2024 | $3,467 | $149,864 | $30,400 | $119,464 |
| 2023 | $3,086 | $152,472 | $28,800 | $123,672 |
| 2022 | $3,308 | $140,476 | $23,600 | $116,876 |
| 2021 | $2,841 | $108,364 | $18,000 | $90,364 |
| 2020 | $2,552 | $95,812 | $14,000 | $81,812 |
| 2019 | $2,389 | $88,800 | $14,000 | $74,800 |
| 2018 | $2,173 | $79,000 | $14,000 | $65,000 |
| 2017 | $2,099 | $187,800 | $14,000 | $61,120 |
| 2016 | $1,875 | $161,000 | $12,800 | $51,600 |
| 2015 | $1,705 | $150,700 | $12,800 | $47,480 |
| 2014 | $1,508 | $133,700 | $12,800 | $40,680 |
Source: Public Records
Map
Nearby Homes
- 636 Arnold Mill Rd
- 632 Arnold Mill Rd
- 624 Arnold Mill Rd
- Dahlonega Elite Plan at Vista Ridge - The Meadows Collection
- Chatuge Plan at Vista Ridge - The Meadows Collection
- Allatoona Plan at Vista Ridge - The Meadows Collection
- Allatoona Elite Plan at Vista Ridge - The Meadows Collection
- Barnsley Plan at Vista Ridge - The Meadows Collection
- 130 Mooney Rd
- Barnsley Elite Plan at Vista Ridge - The Meadows Collection
- Chatuge Elite Plan at Vista Ridge - The Meadows Collection
- 203 Mooney Rd
- Hendricks Plan at Vista Ridge - Highlands Collection
- Serenity Plan at Vista Ridge - Heritage Collection
- Hillside Plan at Vista Ridge - Highlands Collection
- Acworth Plan at Vista Ridge - Heritage Collection
- Antioch Plan at Vista Ridge - Highlands Collection
- Sweetwater w Bsmt Brandywine Plan at Vista Ridge - Heritage Collection
- Wieuca Plan at Vista Ridge - Heritage Collection
- Sweetwater Plan at Vista Ridge - Heritage Collection
- 5010 River Rock Way
- 5014 River Rock Way Unit 6
- 5016 River Rock Way Unit 6
- 7014 Woodfield Way Unit 6
- 5008 River Rock Way
- 5015 River Rock Way
- 5017 River Rock Way Unit 6
- 5013 River Rock Way
- 5018 River Rock Way Unit 6
- 7012 Woodfield Way
- 5006 River Rock Way
- 5011 River Rock Way
- 5023 River Rock Way
- 7013 Woodfield Way
- 5025 River Rock Way Unit 6
- 5019 River Rock Way
- 5020 River Rock Way Unit 6
- 5027 River Rock Way
- 5021 River Rock Way
- 7010 Woodfield Way