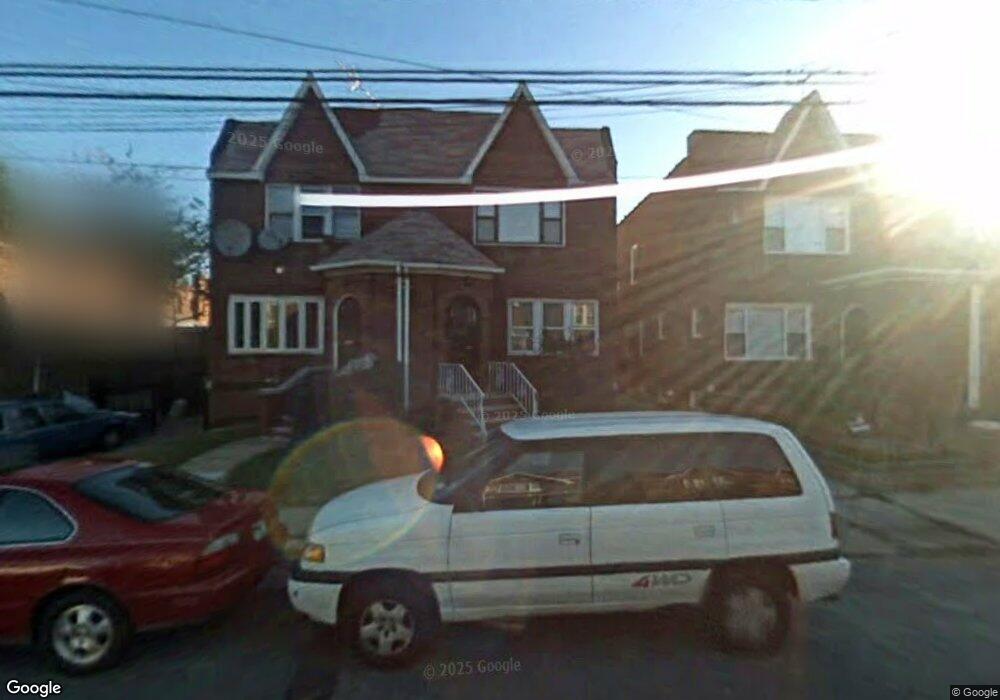
5013 206th St Oakland Gardens, NY 11364
Bayside NeighborhoodEstimated Value: $830,000 - $1,014,000
--
Bed
--
Bath
1,367
Sq Ft
$695/Sq Ft
Est. Value
About This Home
This home is located at 5013 206th St, Oakland Gardens, NY 11364 and is currently estimated at $949,789, approximately $694 per square foot. 5013 206th St is a home located in Queens County with nearby schools including P.S. 162 The John Golden School, P.S. 376, and M.S. 158 - Marie Curie.
Ownership History
Date
Name
Owned For
Owner Type
Purchase Details
Closed on
Feb 24, 2020
Sold by
Suh Kang Sook
Bought by
Li Weicun and Li Yuanyi
Current Estimated Value
Home Financials for this Owner
Home Financials are based on the most recent Mortgage that was taken out on this home.
Original Mortgage
$535,500
Outstanding Balance
$475,157
Interest Rate
3.6%
Mortgage Type
Unknown
Estimated Equity
$474,632
Purchase Details
Closed on
Nov 12, 2019
Sold by
Suh Kang Sook and Yum Kyu Il
Bought by
Suh Kang Sook
Purchase Details
Closed on
Nov 19, 2004
Sold by
Kim Young Hoon and Ok Jung Dong
Bought by
Suh Kang Sook and Yum Kyu Il
Home Financials for this Owner
Home Financials are based on the most recent Mortgage that was taken out on this home.
Original Mortgage
$448,000
Interest Rate
5.69%
Mortgage Type
Purchase Money Mortgage
Purchase Details
Closed on
Nov 17, 1999
Sold by
Kolis Michael J
Bought by
Jung Dong Ok and Kim Young Hoon
Home Financials for this Owner
Home Financials are based on the most recent Mortgage that was taken out on this home.
Original Mortgage
$150,000
Interest Rate
7.61%
Create a Home Valuation Report for This Property
The Home Valuation Report is an in-depth analysis detailing your home's value as well as a comparison with similar homes in the area
Home Values in the Area
Average Home Value in this Area
Purchase History
| Date | Buyer | Sale Price | Title Company |
|---|---|---|---|
| Li Weicun | $765,000 | -- | |
| Suh Kang Sook | -- | -- | |
| Suh Kang Sook | $56,000 | -- | |
| Jung Dong Ok | $249,000 | Chicago Title Insurance Co |
Source: Public Records
Mortgage History
| Date | Status | Borrower | Loan Amount |
|---|---|---|---|
| Open | Li Weicun | $535,500 | |
| Previous Owner | Suh Kang Sook | $448,000 | |
| Previous Owner | Jung Dong Ok | $150,000 |
Source: Public Records
Tax History Compared to Growth
Tax History
| Year | Tax Paid | Tax Assessment Tax Assessment Total Assessment is a certain percentage of the fair market value that is determined by local assessors to be the total taxable value of land and additions on the property. | Land | Improvement |
|---|---|---|---|---|
| 2025 | $7,840 | $41,374 | $7,188 | $34,186 |
| 2024 | $7,840 | $39,035 | $7,608 | $31,427 |
| 2023 | $7,397 | $36,826 | $7,038 | $29,788 |
| 2022 | $7,352 | $50,400 | $10,080 | $40,320 |
| 2021 | $7,691 | $50,820 | $10,080 | $40,740 |
| 2020 | $7,298 | $48,660 | $10,080 | $38,580 |
| 2019 | $6,512 | $49,860 | $10,080 | $39,780 |
| 2018 | $5,958 | $30,688 | $6,593 | $24,095 |
| 2017 | $5,956 | $30,688 | $8,030 | $22,658 |
| 2016 | $5,778 | $30,688 | $8,030 | $22,658 |
| 2015 | $3,272 | $28,732 | $10,061 | $18,671 |
| 2014 | $3,272 | $27,108 | $9,493 | $17,615 |
Source: Public Records
Map
Nearby Homes
- 208-04 50th Ave
- 48-46 206th St Unit 2
- 48-35 Clearview Expy
- 4732 207th St
- 208-2 47th Ave
- 208-4 47th Ave
- 48-18 202nd St
- 4843 201st St
- 50-05 212th St
- 50-44 213th St
- 21115 48th Ave
- 46-27 206th St
- 5612 212th St
- 46-38 204th St
- 58-15 Clearview Expy
- 48-27 213th St
- 204-19 46th Rd
- 206-50 46th Ave
- 48-40 Bell Blvd
- 50-15 199th St