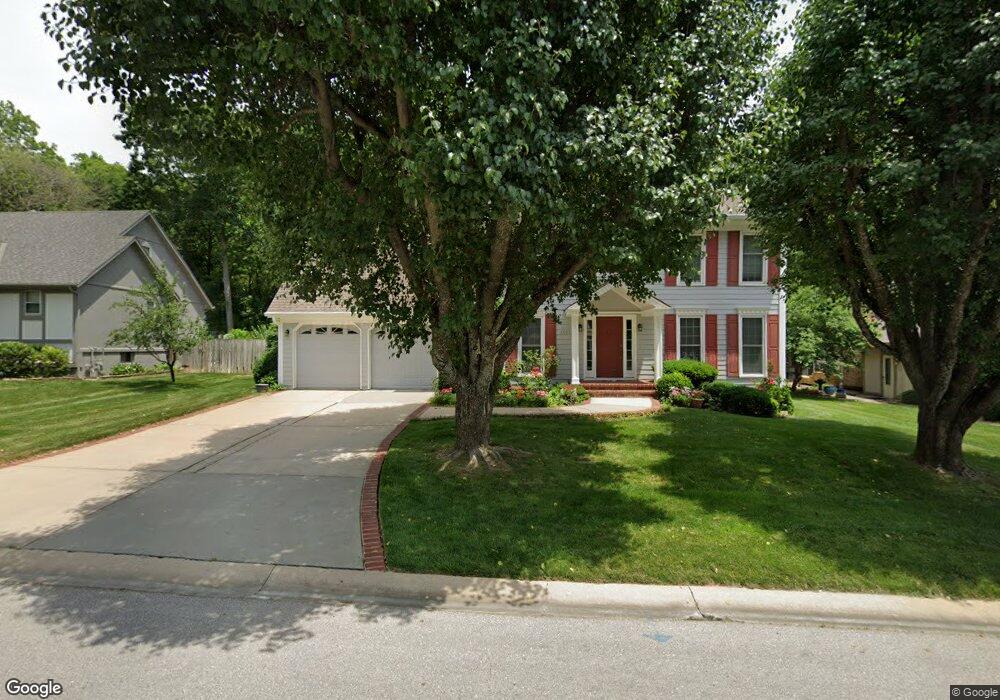
5013 S Cedar Crest Ave Independence, MO 64055
Highland Manor NeighborhoodEstimated Value: $353,226 - $423,000
3
Beds
3
Baths
2,262
Sq Ft
$175/Sq Ft
Est. Value
About This Home
This home is located at 5013 S Cedar Crest Ave, Independence, MO 64055 and is currently estimated at $396,807, approximately $175 per square foot. 5013 S Cedar Crest Ave is a home located in Jackson County with nearby schools including William Southern Elementary School, Bridger Middle School, and Pioneer Ridge Middle School.
Ownership History
Date
Name
Owned For
Owner Type
Purchase Details
Closed on
Aug 15, 2014
Sold by
Farney Nelson and Farney Mary Ellen
Bought by
Farney Nelson E and Farney Mary Ellen
Current Estimated Value
Purchase Details
Closed on
Nov 18, 2002
Sold by
Farney Nelson E and Farney Mary Ellen
Bought by
Farney Nelson E and Farney Mary Ellen
Home Financials for this Owner
Home Financials are based on the most recent Mortgage that was taken out on this home.
Original Mortgage
$53,350
Interest Rate
5.89%
Mortgage Type
Purchase Money Mortgage
Purchase Details
Closed on
Aug 2, 2002
Sold by
Farney Nelson E and Farney Mary Ellen
Bought by
Farney Nelson E and Farney Mary Ellen
Create a Home Valuation Report for This Property
The Home Valuation Report is an in-depth analysis detailing your home's value as well as a comparison with similar homes in the area
Home Values in the Area
Average Home Value in this Area
Purchase History
| Date | Buyer | Sale Price | Title Company |
|---|---|---|---|
| Farney Nelson E | -- | None Available | |
| Farney Nelson E | -- | Coffelt Land Title Inc | |
| Farney Nelson E | -- | Coffelt Land Title Inc | |
| Farney Nelson E | -- | -- |
Source: Public Records
Mortgage History
| Date | Status | Borrower | Loan Amount |
|---|---|---|---|
| Closed | Farney Nelson E | $53,350 | |
| Closed | Farney Nelson E | $47,750 |
Source: Public Records
Tax History
| Year | Tax Paid | Tax Assessment Tax Assessment Total Assessment is a certain percentage of the fair market value that is determined by local assessors to be the total taxable value of land and additions on the property. | Land | Improvement |
|---|---|---|---|---|
| 2025 | $4,658 | $61,813 | $10,720 | $51,093 |
| 2024 | $4,658 | $67,910 | $9,245 | $58,665 |
| 2023 | $4,562 | $67,910 | $11,913 | $55,997 |
| 2022 | $3,589 | $46,740 | $4,842 | $41,898 |
| 2021 | $3,587 | $46,740 | $4,842 | $41,898 |
| 2020 | $3,177 | $40,784 | $4,842 | $35,942 |
| 2019 | $3,071 | $40,784 | $4,842 | $35,942 |
| 2018 | $2,754 | $35,495 | $4,214 | $31,281 |
| 2016 | $2,713 | $35,118 | $6,654 | $28,464 |
Source: Public Records
Map
Nearby Homes
- 332 NE Parks Edge Dr
- 17201 E 32nd Unit 9 St Unit 9
- 304 NE Hidden Valley Way
- 6125 NE Moonstone Ct
- 6020 NE Moonstone Dr
- 6033 NE Moonstone Dr
- 17305 E 52nd St S
- 5821 NE Coral Dr
- 5920 NE Ruby Ln
- 6160 NE Kensington Dr
- 6011 NE Kensington Ct
- 6115 NE Kensington Dr
- 5801 NE Hidden Meadow Cir
- 17318 E Us Highway 40
- 4921 S Peck Ave
- 5416 S Downey Ct
- 5707 NW Sunrise Meadow Cir
- 5805 NE Ruby Ct
- 6122 NE Upper Wood Rd
- 17105 E 45th St S
- 5009 S Cedar Crest Ave
- 5017 S Cedar Crest Ave
- 5005 S Cedar Crest Ave
- 5016 S Cedar Crest Ave
- 5020 S Cedar Crest Ave
- 5021 S Cedar Crest Ave
- 5012 S Cedar Crest Ave
- 5008 S Cedar Crest Ave
- 5001 S Cedar Crest Ave
- 5004 S Cedar Crest Ave
- 18108 E 51st Street Ct S
- 18101 E 50th Terrace Ct S
- 5101 S Cedar Crest Ct
- 5100 S Cedar Crest Ct
- 18107 E 51st Street Ct S
- 18112 E 51st Street Ct S
- 18107 E 51st St Ct
- 18105 E 50th Terrace Ct S
- 18100 E 50th Terrace Ct S
- 17911 E 49th Terrace Ct S
Your Personal Tour Guide
Ask me questions while you tour the home.