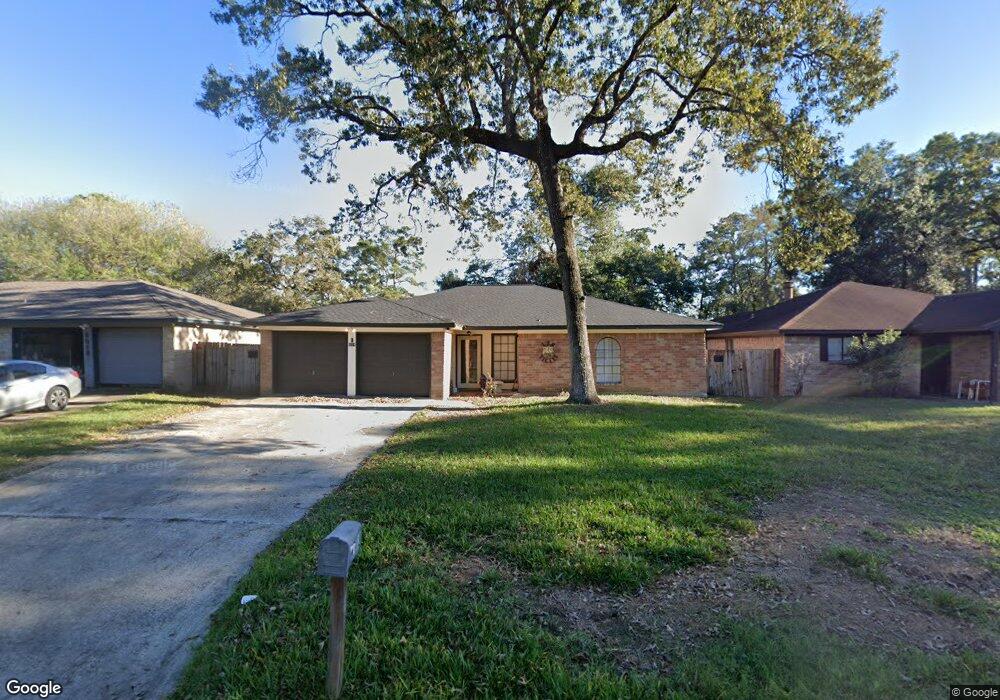
5014 Monteith Dr Spring, TX 77373
Estimated Value: $206,000 - $223,000
3
Beds
2
Baths
1,576
Sq Ft
$136/Sq Ft
Est. Value
About This Home
This home is located at 5014 Monteith Dr, Spring, TX 77373 and is currently estimated at $214,867, approximately $136 per square foot. 5014 Monteith Dr is a home located in Harris County with nearby schools including Mildred Jenkins Elementary School, Dueitt Middle School, and Spring High School.
Ownership History
Date
Name
Owned For
Owner Type
Purchase Details
Closed on
Oct 21, 2004
Sold by
King John D
Bought by
King John D and King Leigh A
Current Estimated Value
Home Financials for this Owner
Home Financials are based on the most recent Mortgage that was taken out on this home.
Original Mortgage
$71,763
Outstanding Balance
$35,398
Interest Rate
5.71%
Mortgage Type
FHA
Estimated Equity
$179,469
Purchase Details
Closed on
Oct 30, 2000
Sold by
Mulhern Timothy J and Mulhern Maria
Bought by
King John D
Home Financials for this Owner
Home Financials are based on the most recent Mortgage that was taken out on this home.
Original Mortgage
$68,900
Interest Rate
7.87%
Mortgage Type
FHA
Purchase Details
Closed on
Dec 8, 1998
Sold by
Lau David K C
Bought by
Mulhern Timothy J and Mulhern Maria
Home Financials for this Owner
Home Financials are based on the most recent Mortgage that was taken out on this home.
Original Mortgage
$48,050
Interest Rate
6.87%
Create a Home Valuation Report for This Property
The Home Valuation Report is an in-depth analysis detailing your home's value as well as a comparison with similar homes in the area
Home Values in the Area
Average Home Value in this Area
Purchase History
| Date | Buyer | Sale Price | Title Company |
|---|---|---|---|
| King John D | -- | -- | |
| King John D | -- | -- | |
| Mulhern Timothy J | -- | American Title Company |
Source: Public Records
Mortgage History
| Date | Status | Borrower | Loan Amount |
|---|---|---|---|
| Open | King John D | $71,763 | |
| Closed | King John D | $68,900 | |
| Previous Owner | Mulhern Timothy J | $48,050 |
Source: Public Records
Tax History
| Year | Tax Paid | Tax Assessment Tax Assessment Total Assessment is a certain percentage of the fair market value that is determined by local assessors to be the total taxable value of land and additions on the property. | Land | Improvement |
|---|---|---|---|---|
| 2025 | $1,843 | $234,371 | $49,170 | $185,201 |
| 2024 | $1,843 | $247,674 | $49,170 | $198,504 |
| 2023 | $1,843 | $247,674 | $49,170 | $198,504 |
| 2022 | $3,708 | $210,758 | $49,434 | $161,324 |
| 2021 | $3,572 | $164,113 | $17,160 | $146,953 |
| 2020 | $3,448 | $155,052 | $17,160 | $137,892 |
| 2019 | $3,232 | $152,640 | $17,160 | $135,480 |
| 2018 | $2,005 | $134,686 | $17,160 | $117,526 |
| 2017 | $2,611 | $134,686 | $17,160 | $117,526 |
| 2016 | $2,374 | $120,696 | $17,160 | $103,536 |
| 2015 | $1,654 | $105,360 | $17,160 | $88,200 |
| 2014 | $1,654 | $81,947 | $17,160 | $64,787 |
Source: Public Records
Map
Nearby Homes
- 5023 Glendower Dr
- 4922 Glendower Dr
- 23206 Goodfellow Dr
- 5027 Monteith Dr
- 5031 Monteith Dr
- 5311 Oaklynn Dr
- 5402 Sherrylee Ln
- 5414 Sweetwind Ln
- 5002 Maurita Dr
- 5407 Rushstone Ln
- 4707 Glendower Dr
- 4314 Wyanngate Dr
- 5314 Sweetwind Ln
- 5414 Honeybear Ln
- 23022 Laketree Ln
- 5311 Sweetwind Ln
- 5410 Dibello Forest Ln
- 22823 W Fairfax Village Cir
- 4822 S Fairfax Village Cir
- 5015 Yellow Ginko Trail
- 5010 Monteith Dr
- 5018 Monteith Dr
- 5015 Fitzwater Dr
- 5006 Monteith Dr
- 5011 Fitzwater Dr
- 5019 Fitzwater Dr
- 5022 Monteith Dr
- 5007 Fitzwater Dr
- 5023 Fitzwater Dr
- 5011 Monteith Dr
- 5002 Monteith Dr
- 5019 Monteith Dr
- 5026 Monteith Dr
- 5007 Monteith Dr
- 5003 Fitzwater Dr
- 5027 Fitzwater Dr
- 5023 Monteith Dr
- 5003 Monteith Dr
- 4930 Monteith Dr
- 5030 Monteith Dr
Your Personal Tour Guide
Ask me questions while you tour the home.