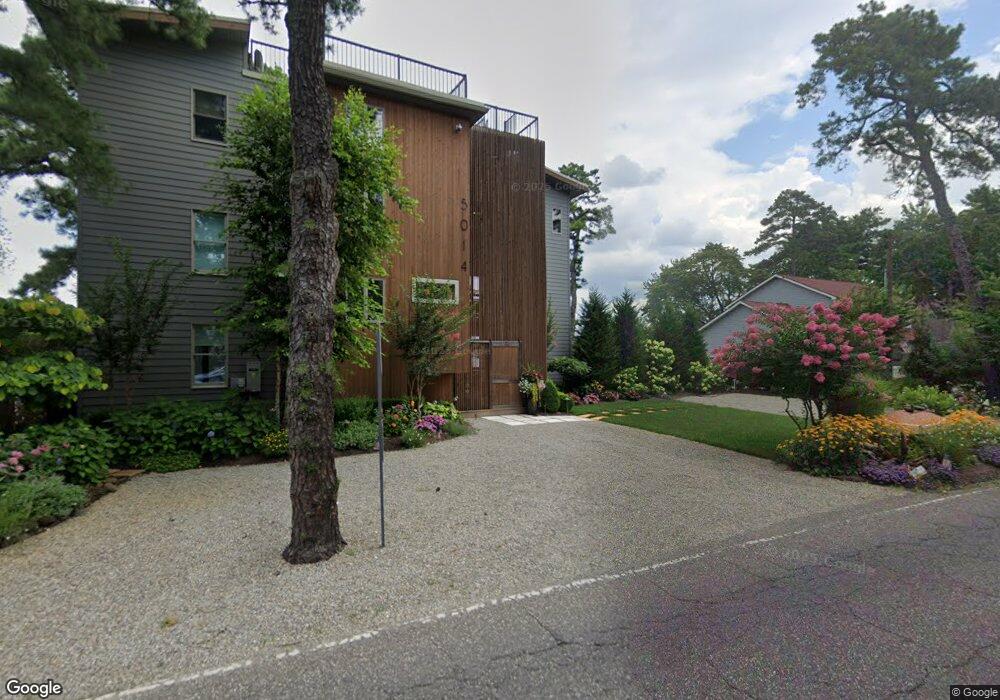
5014 Pleasant Mills Rd Hammonton, NJ 08037
Estimated Value: $306,000 - $605,663
--
Bed
--
Bath
586
Sq Ft
$770/Sq Ft
Est. Value
About This Home
This home is located at 5014 Pleasant Mills Rd, Hammonton, NJ 08037 and is currently estimated at $451,166, approximately $769 per square foot. 5014 Pleasant Mills Rd is a home located in Atlantic County with nearby schools including Mullica Township Primary School, Mullica Township Elementary & Middle School, and Cedar Creek High School.
Ownership History
Date
Name
Owned For
Owner Type
Purchase Details
Closed on
Sep 9, 2020
Sold by
Antram Shaun
Bought by
Reynolds Mark and Reynolds Margaret
Current Estimated Value
Purchase Details
Closed on
Sep 7, 2020
Sold by
Antram Shaun
Bought by
Reynolds Mark and Reynolds Margaret
Purchase Details
Closed on
Dec 15, 1997
Sold by
Hall Doris
Bought by
Antram Shaun G and Antram Susan
Home Financials for this Owner
Home Financials are based on the most recent Mortgage that was taken out on this home.
Original Mortgage
$67,500
Interest Rate
6.87%
Mortgage Type
Purchase Money Mortgage
Purchase Details
Closed on
Jul 28, 1997
Sold by
Wylde William H and Metcalf George B
Bought by
Hall Doris
Create a Home Valuation Report for This Property
The Home Valuation Report is an in-depth analysis detailing your home's value as well as a comparison with similar homes in the area
Home Values in the Area
Average Home Value in this Area
Purchase History
| Date | Buyer | Sale Price | Title Company |
|---|---|---|---|
| Reynolds Mark | $150,000 | University Ttl Ins Agcy Inc | |
| Reynolds Mark | $150,000 | Old Republic Title | |
| Antram Shaun G | $90,000 | -- | |
| Hall Doris | -- | -- |
Source: Public Records
Mortgage History
| Date | Status | Borrower | Loan Amount |
|---|---|---|---|
| Previous Owner | Antram Shaun G | $67,500 |
Source: Public Records
Tax History Compared to Growth
Tax History
| Year | Tax Paid | Tax Assessment Tax Assessment Total Assessment is a certain percentage of the fair market value that is determined by local assessors to be the total taxable value of land and additions on the property. | Land | Improvement |
|---|---|---|---|---|
| 2025 | $14,442 | $401,400 | $121,900 | $279,500 |
| 2024 | $14,442 | $401,400 | $121,900 | $279,500 |
| 2023 | $13,692 | $401,400 | $121,900 | $279,500 |
| 2022 | $13,692 | $401,400 | $121,900 | $279,500 |
| 2021 | $3,993 | $121,900 | $121,900 | $0 |
| 2020 | $5,179 | $162,300 | $121,900 | $40,400 |
| 2019 | $5,075 | $162,300 | $121,900 | $40,400 |
| 2018 | $4,430 | $94,300 | $65,100 | $29,200 |
| 2017 | $4,426 | $94,300 | $65,100 | $29,200 |
| 2016 | $4,165 | $94,300 | $65,100 | $29,200 |
| 2015 | $3,958 | $94,300 | $65,100 | $29,200 |
| 2014 | $3,913 | $94,300 | $65,100 | $29,200 |
Source: Public Records
Map
Nearby Homes
- 4832 Pleasant Mills Rd
- 4823 Pleasant Mills Rd
- 2668 Camp Swiss Ave
- 2551 7th Ave
- 5143 Venice Ave
- 4528 Indian Cabin Terrace
- 2150 8th Ave
- 4119 Nesco Rd
- 124 5th Ave
- 4930 Moss Mill Rd
- 0 Philadelphia Ave
- 13 Charles Ave
- 0 Columbia Rd Unit NJAC2012962
- 0 Columbia Rd Unit 586593
- 5708 Moss Mill Rd
- 4821 Moss Mill Rd
- 900 Elwood Rd
- 900 Elwood Rd Unit MULLICA TWP
- 6 Fawn Ln
- 700 Columbia Rd
- 5018 Pleasant Mills Rd
- 5012 Pleasant Mills Rd
- 5010 Pleasant Mills Rd
- 5022 Pleasant Mills Rd
- 5004 Pleasant Mills Rd
- 5013 Pleasant Mills Rd
- 5007 Pleasant Mills Rd
- 5019 Pleasant Mills Rd
- 5001 Pleasant Mills Rd
- 5026 Pleasant Mills Rd
- 5025 Pleasant Mills Rd
- 5032 Pleasant Mills Rd
- 4955 Pleasant Mills Rd
- 2688 8th Ave
- 5038 Pleasant Mills Rd
- 4941 Pleasant Mills Rd
- 5040 Pleasant Mills Rd
- 5044 Pleasant Mills Rd
- 4940 Pleasant Mills Rd
- 4929 Pleasant Mills Rd