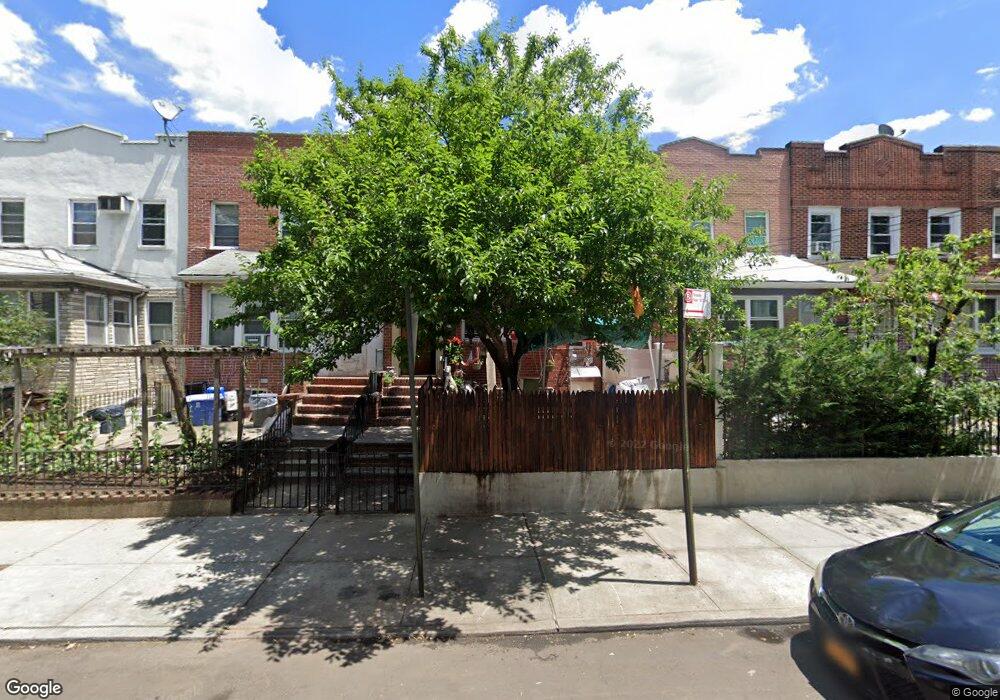
5015 47th St Woodside, NY 11377
Sunnyside NeighborhoodEstimated Value: $1,005,482 - $1,355,000
--
Bed
--
Bath
2,048
Sq Ft
$584/Sq Ft
Est. Value
About This Home
This home is located at 5015 47th St, Woodside, NY 11377 and is currently estimated at $1,196,121, approximately $584 per square foot. 5015 47th St is a home located in Queens County with nearby schools including P.S. 199 Maurice A Fitzgerald, William Cullen Bryant High School, and Razi School.
Ownership History
Date
Name
Owned For
Owner Type
Purchase Details
Closed on
Jun 17, 2008
Sold by
Pulgarin Tomas E
Bought by
Pulgarin Gustavo N
Current Estimated Value
Purchase Details
Closed on
Sep 7, 2007
Sold by
Hossain Qader
Bought by
Pulgarin Tomas E
Home Financials for this Owner
Home Financials are based on the most recent Mortgage that was taken out on this home.
Original Mortgage
$127,400
Outstanding Balance
$80,540
Interest Rate
6.63%
Estimated Equity
$1,115,581
Purchase Details
Closed on
Jul 25, 2006
Sold by
Kim Deceased Grace J and Kim Kim
Bought by
Hossain Qader
Home Financials for this Owner
Home Financials are based on the most recent Mortgage that was taken out on this home.
Original Mortgage
$111,600
Interest Rate
6.8%
Create a Home Valuation Report for This Property
The Home Valuation Report is an in-depth analysis detailing your home's value as well as a comparison with similar homes in the area
Home Values in the Area
Average Home Value in this Area
Purchase History
| Date | Buyer | Sale Price | Title Company |
|---|---|---|---|
| Pulgarin Gustavo N | -- | -- | |
| Pulgarin Gustavo N | -- | -- | |
| Pulgarin Tomas E | $850,000 | -- | |
| Pulgarin Tomas E | $850,000 | -- | |
| Hossain Qader | $558,000 | -- | |
| Hossain Qader | $558,000 | -- |
Source: Public Records
Mortgage History
| Date | Status | Borrower | Loan Amount |
|---|---|---|---|
| Open | Pulgarin Tomas E | $127,400 | |
| Closed | Pulgarin Tomas E | $127,400 | |
| Open | Pulgarin Tomas E | $680,000 | |
| Closed | Pulgarin Tomas E | $680,000 | |
| Previous Owner | Hossain Qader | $111,600 | |
| Previous Owner | Hossain Qader | $446,400 |
Source: Public Records
Tax History Compared to Growth
Tax History
| Year | Tax Paid | Tax Assessment Tax Assessment Total Assessment is a certain percentage of the fair market value that is determined by local assessors to be the total taxable value of land and additions on the property. | Land | Improvement |
|---|---|---|---|---|
| 2025 | $7,933 | $41,460 | $3,905 | $37,555 |
| 2024 | $7,933 | $39,499 | $3,854 | $35,645 |
| 2023 | $7,544 | $37,559 | $3,329 | $34,230 |
| 2022 | $7,155 | $78,000 | $7,200 | $70,800 |
| 2021 | $7,271 | $70,320 | $7,200 | $63,120 |
| 2020 | $7,313 | $70,740 | $7,200 | $63,540 |
| 2019 | $6,886 | $60,600 | $7,200 | $53,400 |
| 2018 | $6,380 | $31,299 | $5,282 | $26,017 |
| 2017 | $6,089 | $29,869 | $4,480 | $25,389 |
| 2016 | $5,756 | $29,869 | $4,480 | $25,389 |
| 2015 | $3,399 | $28,792 | $5,802 | $22,990 |
| 2014 | $3,399 | $27,430 | $5,570 | $21,860 |
Source: Public Records
Map
Nearby Homes
- 50-05 46th St
- 50-43 48th St
- 50-56 47th St
- 48-41 45th St
- 51-17 47th St Unit 2
- 48-50 44th St Unit 4E
- 48-56 44th St Unit 2H
- 48-55 43rd St Unit 4H
- 48-19 43rd St Unit 4D
- 4310 48th Ave Unit 2A
- 4310 48th Ave Unit 2F
- 43-10 48th Ave Unit 2A
- 43-10 48th Ave Unit 2P
- 43-10 48th Ave Unit . 2J
- 5068 43rd St
- 48-41 43rd St Unit 5F
- 48-17 42nd St Unit 2C
- 48-17 42nd St Unit 7B
- 48-23 42nd St Unit 1 J
- 48-01 42nd St Unit 5D