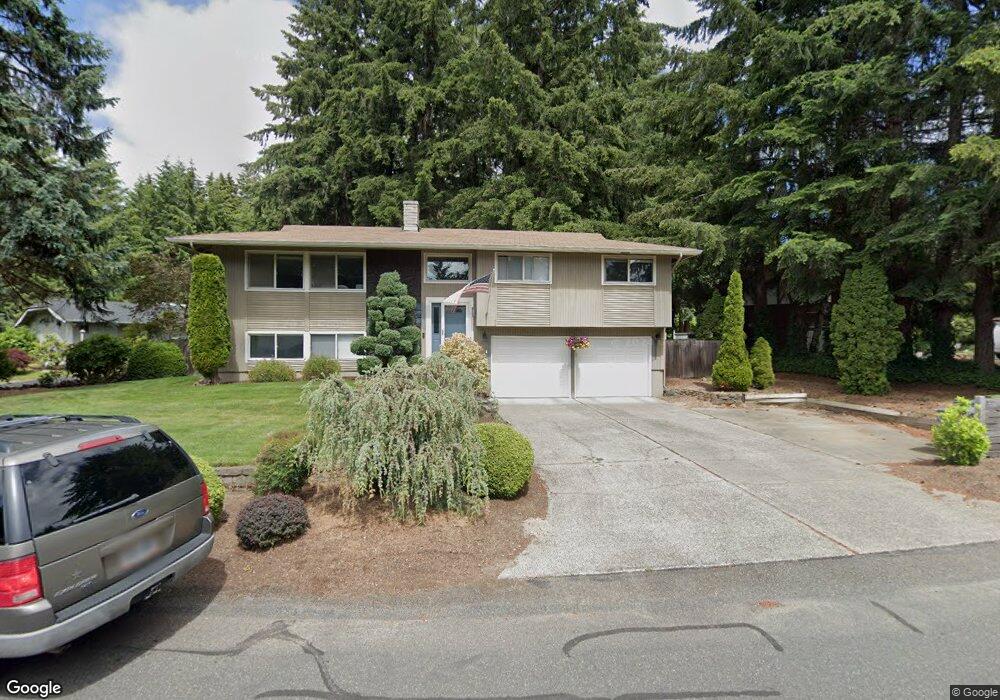
5015 96th Ave W University Place, WA 98467
Estimated Value: $631,000 - $660,000
3
Beds
3
Baths
1,916
Sq Ft
$335/Sq Ft
Est. Value
About This Home
This home is located at 5015 96th Ave W, University Place, WA 98467 and is currently estimated at $642,166, approximately $335 per square foot. 5015 96th Ave W is a home located in Pierce County with nearby schools including Evergreen Primary School, Chambers Elementary School, and Drum Intermediate School.
Ownership History
Date
Name
Owned For
Owner Type
Purchase Details
Closed on
Oct 25, 2006
Sold by
Heenan John A and Heenan Racehelle F
Bought by
Kent Ronald G and Kent Trisha R
Current Estimated Value
Home Financials for this Owner
Home Financials are based on the most recent Mortgage that was taken out on this home.
Original Mortgage
$285,950
Outstanding Balance
$185,444
Interest Rate
7.99%
Mortgage Type
Purchase Money Mortgage
Estimated Equity
$456,722
Purchase Details
Closed on
Jun 23, 2003
Sold by
Grant Denise C
Bought by
Heenan John A and Heenan Racehelle F
Home Financials for this Owner
Home Financials are based on the most recent Mortgage that was taken out on this home.
Original Mortgage
$194,275
Interest Rate
5.37%
Mortgage Type
Purchase Money Mortgage
Purchase Details
Closed on
Mar 11, 1994
Sold by
Grant Michael
Bought by
Grant Denise C
Home Financials for this Owner
Home Financials are based on the most recent Mortgage that was taken out on this home.
Original Mortgage
$112,000
Interest Rate
7.21%
Create a Home Valuation Report for This Property
The Home Valuation Report is an in-depth analysis detailing your home's value as well as a comparison with similar homes in the area
Home Values in the Area
Average Home Value in this Area
Purchase History
| Date | Buyer | Sale Price | Title Company |
|---|---|---|---|
| Kent Ronald G | $301,000 | Lawyers Title | |
| Heenan John A | $204,500 | Ticor Title Company | |
| Grant Denise C | -- | Stewart Title Company |
Source: Public Records
Mortgage History
| Date | Status | Borrower | Loan Amount |
|---|---|---|---|
| Open | Kent Ronald G | $285,950 | |
| Previous Owner | Heenan John A | $194,275 | |
| Previous Owner | Grant Denise C | $112,000 |
Source: Public Records
Tax History Compared to Growth
Tax History
| Year | Tax Paid | Tax Assessment Tax Assessment Total Assessment is a certain percentage of the fair market value that is determined by local assessors to be the total taxable value of land and additions on the property. | Land | Improvement |
|---|---|---|---|---|
| 2025 | $6,240 | $596,100 | $318,300 | $277,800 |
| 2024 | $6,240 | $587,900 | $313,800 | $274,100 |
| 2023 | $6,240 | $523,500 | $277,100 | $246,400 |
| 2022 | $5,786 | $562,800 | $291,800 | $271,000 |
| 2021 | $5,420 | $389,800 | $187,400 | $202,400 |
| 2019 | $4,434 | $355,200 | $160,600 | $194,600 |
| 2018 | $4,718 | $341,000 | $145,900 | $195,100 |
| 2017 | $4,205 | $299,800 | $119,200 | $180,600 |
| 2016 | $3,809 | $249,500 | $92,500 | $157,000 |
| 2014 | $3,540 | $217,000 | $79,600 | $137,400 |
| 2013 | $3,540 | $207,500 | $75,900 | $131,600 |
Source: Public Records
Map
Nearby Homes
- 5002 95th Ave W
- 4819 96th Ave W
- 4942 97th Avenue Ct W
- 4623 Grandview Dr W Unit B
- 4501 Grandview Dr W Unit T105
- 9903 View St W
- 9610 55th Street Ct W
- 5505 Oxalis Dr W
- 4250 Beckonridge Dr W
- 4234 Beckonridge Dr W
- 4403 Paradise Ave W
- 8902 45th St W
- 8707 45th St W
- 8310 52nd Street Ct W
- 8323 Cirque Dr W Unit 4
- 8319 Cirque Dr W Unit 3
- 8501 42nd St W
- 8214 42nd Street Ct W
- 8204 42nd St W
- 8820 Chambers Creek Rd W
- 5009 96th Ave W
- 9529 51st St W
- 5008 96th Ave W
- 5005 96th Ave W
- 9523 51st St W
- 9534 51st St W
- 5016 96th Ave W
- 9530 51st St W
- 5110 96th Ave W
- 5001 96th Ave W
- 5002 96th Ave W
- 5009 Bristonwood Dr W
- 9526 51st St W
- 9519 51st St W
- 9522 51st St W
- 5001 Bristonwood Dr W
- 5121 Bristonwood Dr W
- 5133 Bristonwood Dr W
- 9518 51st St W
- 9513 51st St W