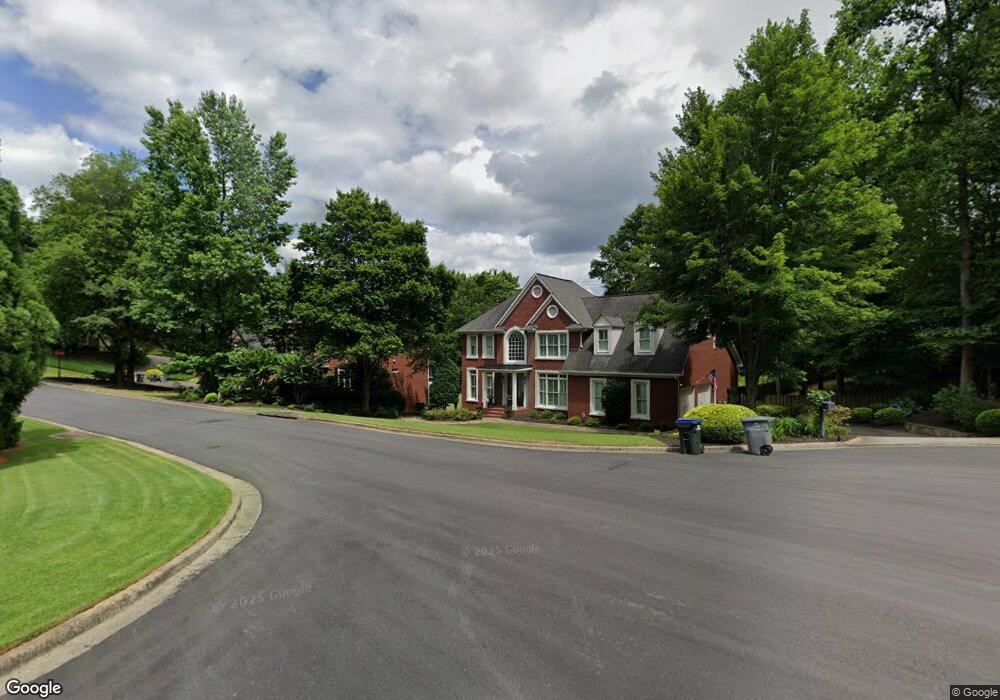
5015 Bonnie Way Roswell, GA 30075
Estimated Value: $841,000 - $952,000
4
Beds
5
Baths
2,988
Sq Ft
$297/Sq Ft
Est. Value
About This Home
This home is located at 5015 Bonnie Way, Roswell, GA 30075 and is currently estimated at $886,753, approximately $296 per square foot. 5015 Bonnie Way is a home located in Fulton County with nearby schools including Roswell North Elementary School, Crabapple Middle School, and High Meadows School.
Ownership History
Date
Name
Owned For
Owner Type
Purchase Details
Closed on
Apr 28, 2010
Sold by
Roeser Rodney W
Bought by
Roeser Rodney W and Roeser Mitzi K
Current Estimated Value
Home Financials for this Owner
Home Financials are based on the most recent Mortgage that was taken out on this home.
Original Mortgage
$351,200
Outstanding Balance
$235,511
Interest Rate
5.06%
Mortgage Type
New Conventional
Estimated Equity
$651,242
Purchase Details
Closed on
Dec 1, 2005
Sold by
Jones John and Jones Dianne
Bought by
Baker Jennifer A
Home Financials for this Owner
Home Financials are based on the most recent Mortgage that was taken out on this home.
Original Mortgage
$359,000
Interest Rate
6.1%
Mortgage Type
New Conventional
Purchase Details
Closed on
Jun 28, 2002
Sold by
Riviere David B and Riviere Gretchen B
Bought by
Jones John and Jones Dianne
Purchase Details
Closed on
Oct 20, 1995
Sold by
John Wieland Homes Inc
Bought by
Riviere David B Gretchen B
Create a Home Valuation Report for This Property
The Home Valuation Report is an in-depth analysis detailing your home's value as well as a comparison with similar homes in the area
Home Values in the Area
Average Home Value in this Area
Purchase History
| Date | Buyer | Sale Price | Title Company |
|---|---|---|---|
| Roeser Rodney W | -- | -- | |
| Roeser Rodney W | $439,000 | -- | |
| Baker Jennifer A | $450,000 | -- | |
| Jones John | $427,000 | -- | |
| Riviere David B Gretchen B | $302,000 | -- |
Source: Public Records
Mortgage History
| Date | Status | Borrower | Loan Amount |
|---|---|---|---|
| Open | Roeser Rodney W | $351,200 | |
| Previous Owner | Baker Jennifer A | $359,000 | |
| Closed | Riviere David B Gretchen B | $0 |
Source: Public Records
Tax History Compared to Growth
Tax History
| Year | Tax Paid | Tax Assessment Tax Assessment Total Assessment is a certain percentage of the fair market value that is determined by local assessors to be the total taxable value of land and additions on the property. | Land | Improvement |
|---|---|---|---|---|
| 2025 | $1,194 | $285,080 | $84,080 | $201,000 |
| 2023 | $8,245 | $292,120 | $107,800 | $184,320 |
| 2022 | $5,114 | $248,920 | $60,440 | $188,480 |
| 2021 | $6,068 | $233,280 | $55,040 | $178,240 |
| 2020 | $6,155 | $223,280 | $46,600 | $176,680 |
| 2019 | $987 | $219,320 | $45,760 | $173,560 |
| 2018 | $5,359 | $214,160 | $44,680 | $169,480 |
| 2017 | $5,060 | $190,160 | $37,480 | $152,680 |
| 2016 | $5,035 | $190,160 | $37,480 | $152,680 |
| 2015 | $6,091 | $190,160 | $37,480 | $152,680 |
| 2014 | $4,536 | $160,720 | $31,680 | $129,040 |
Source: Public Records
Map
Nearby Homes
- 3245 Bywater Trail Unit 6B
- 220 High Branch Way
- The Carrington Plan at Hillandale in Historic Roswell
- The Rocklyn Plan at Hillandale in Historic Roswell
- The Grafton Plan at Hillandale in Historic Roswell
- The Greighton Plan at Hillandale in Historic Roswell
- 1009 Lake Pointe Cir
- 1204 Lake Pointe Cir
- 4035 Connolly Ct
- 1826 Jacksons Creek Dr
- 3210 Lake Pointe Cir
- 3113 Lake Pointe Cir
- 355 Highlands Trace
- 4013 Lake Pointe Cir Unit 4013
- 2039 Old Forge Way
- 9035 Sandorn Dr
- 1731 E Bank Dr
- 8075 Sandorn Dr
- 105 Inverness Approach
- 3960 Inverness Crossing
- 3970 Inverness Crossing
- 3980 Inverness Crossing
- 3975 Inverness Crossing
- 3965 Inverness Crossing
- 5020 Bonnie Way
- 3955 Inverness Crossing
- 3945 Inverness Crossing
- 2265 Azalea Dr
- 9015 Willeo Rd
- 0 Inverness Crossing Unit 7534563
- 0 Inverness Crossing Unit 7063176
- 0 Inverness Crossing Unit 8846302
- 0 Inverness Crossing Unit 7572088
- 0 Inverness Crossing Unit 8469099
- 0 Inverness Crossing
- 2255 Azalea Dr
- 4000 Inverness Crossing
- 6010 Loch Harbor Ct
- 4015 Inverness Crossing