5015 Brookfield St Unit 15 Lehigh Acres, FL 33971
Centennial NeighborhoodEstimated Value: $267,286 - $321,000
3
Beds
2
Baths
1,841
Sq Ft
$159/Sq Ft
Est. Value
About This Home
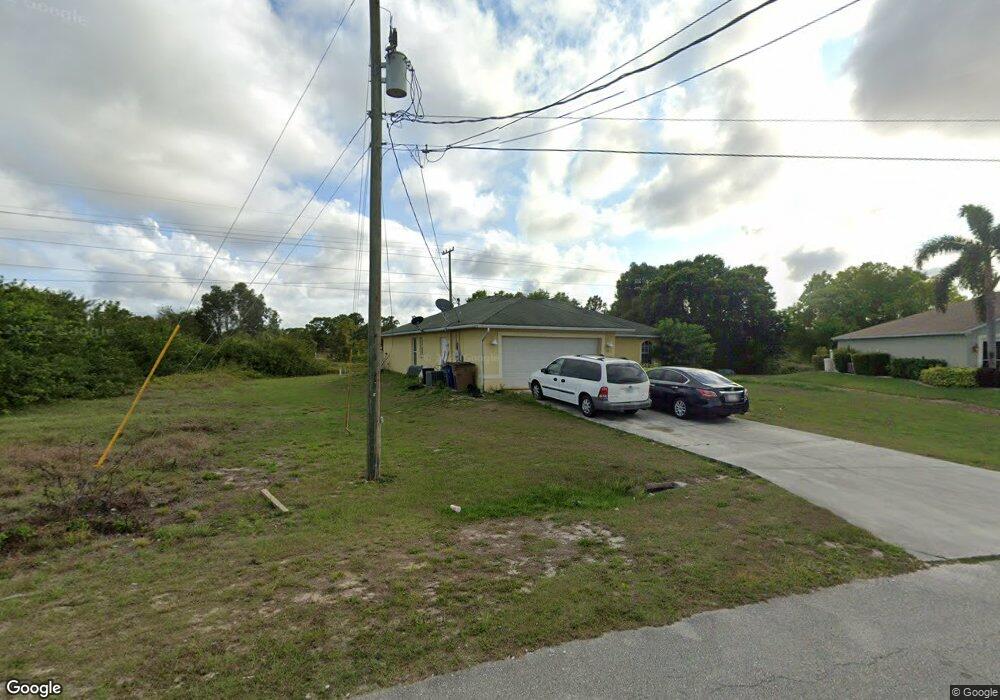
This home is located at 5015 Brookfield St Unit 15, Lehigh Acres, FL 33971 and is currently estimated at $293,322, approximately $159 per square foot. 5015 Brookfield St Unit 15 is a home located in Lee County with nearby schools including Gateway Elementary School, Lehigh Elementary School, and Tice Elementary School.
Ownership History
Date
Name
Owned For
Owner Type
Purchase Details
Closed on
Dec 18, 2009
Sold by
Wells Fargo Bank Na
Bought by
Ramnauth Basantie
Current Estimated Value
Purchase Details
Closed on
May 29, 2009
Sold by
Henriquez Daniel A
Bought by
Wells Fargo Bank Na
Purchase Details
Closed on
Sep 29, 2006
Sold by
Cabrera Dominguez Luis and Dominguez Alicia
Bought by
Henriquez Daniel A
Home Financials for this Owner
Home Financials are based on the most recent Mortgage that was taken out on this home.
Original Mortgage
$240,000
Interest Rate
7.2%
Mortgage Type
Balloon
Purchase Details
Closed on
Feb 12, 2004
Sold by
Mccormick Edward J and Mccormick Carole
Bought by
Cabrera Dominguez Luis and Dominguez Alicia
Home Financials for this Owner
Home Financials are based on the most recent Mortgage that was taken out on this home.
Original Mortgage
$149,328
Interest Rate
5.62%
Mortgage Type
Unknown
Create a Home Valuation Report for This Property
The Home Valuation Report is an in-depth analysis detailing your home's value as well as a comparison with similar homes in the area
Home Values in the Area
Average Home Value in this Area
Purchase History
| Date | Buyer | Sale Price | Title Company |
|---|---|---|---|
| Ramnauth Basantie | $50,900 | Attorney | |
| Wells Fargo Bank Na | -- | Attorney | |
| Henriquez Daniel A | $300,000 | Global Title Company | |
| Cabrera Dominguez Luis | $15,900 | Safe Harbor Title |
Source: Public Records
Mortgage History
| Date | Status | Borrower | Loan Amount |
|---|---|---|---|
| Previous Owner | Henriquez Daniel A | $240,000 | |
| Previous Owner | Cabrera Dominguez Luis | $149,328 |
Source: Public Records
Tax History Compared to Growth
Tax History
| Year | Tax Paid | Tax Assessment Tax Assessment Total Assessment is a certain percentage of the fair market value that is determined by local assessors to be the total taxable value of land and additions on the property. | Land | Improvement |
|---|---|---|---|---|
| 2025 | $3,267 | $198,492 | -- | -- |
| 2024 | $2,840 | $180,447 | -- | -- |
| 2023 | $3,162 | $164,043 | $0 | $0 |
| 2022 | $2,840 | $149,130 | $0 | $0 |
| 2021 | $2,426 | $158,918 | $11,000 | $147,918 |
| 2020 | $2,332 | $148,582 | $9,000 | $139,582 |
| 2019 | $2,304 | $148,580 | $7,000 | $141,580 |
| 2018 | $2,175 | $137,284 | $6,600 | $130,684 |
| 2017 | $2,073 | $130,018 | $5,750 | $124,268 |
| 2016 | $1,880 | $109,338 | $5,750 | $103,588 |
| 2015 | $1,736 | $95,913 | $4,060 | $91,853 |
| 2014 | $1,527 | $84,198 | $3,685 | $80,513 |
| 2013 | -- | $68,695 | $3,000 | $65,695 |
Source: Public Records
Map
Nearby Homes
- 4920 Brookfield St
- 5201 Brookfield St
- 4916 7th St W Unit 6
- Plan 1540 at Greenbriar - Lehigh Acres
- Plan 2010 at Greenbriar - Lehigh Acres
- Plan 2117 at Greenbriar - Lehigh Acres
- Plan 1755 at Greenbriar - Lehigh Acres
- Plan 1540 at Greenbriar
- Plan 2169 at Greenbriar - Lehigh Acres
- Plan 2169 at Greenbriar
- Plan 2117 at Greenbriar
- Plan 2265 at Greenbriar
- Plan 2010 at Greenbriar
- Plan 2265 at Greenbriar - Lehigh Acres
- Plan 1755 at Greenbriar
- 821 Carlfield Ave
- 5110 5th St W
- 4907 Berryman St
- 5202 6th St W
- 5204 6th St W
- 5017 Brookfield St
- 5011 Brookfield St
- 5018 Brookfield St
- 5009 Brookfield St
- 5010 Brookfield St
- 5017 Berryman St
- 5013 Berryman St Unit 15
- 5007 Brookfield St Unit 15
- 5011 Berryman St
- 5104 Lee Cir N
- 5009 Berryman St
- 5112 Lee Blvd
- 5106 Lee Blvd
- 805 Chaplin Ave Unit 12
- 5004 Brookfield St
- 5007 Berryman St Unit 15
- 5102 Lee Blvd Unit 6
- 4932 7th St W
- 5003 Brookfield St
- 5005 Berryman St Unit 15