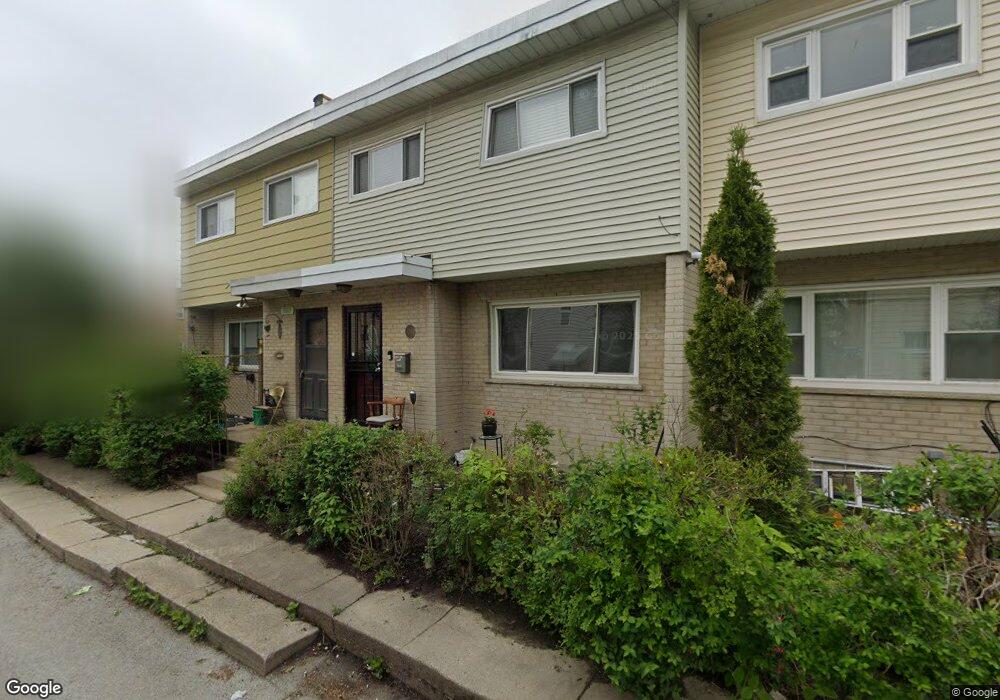
5015 Suffield Ct Skokie, IL 60077
Southwest Skokie NeighborhoodEstimated Value: $294,000 - $374,000
3
Beds
2
Baths
1,116
Sq Ft
$285/Sq Ft
Est. Value
About This Home
This home is located at 5015 Suffield Ct, Skokie, IL 60077 and is currently estimated at $318,245, approximately $285 per square foot. 5015 Suffield Ct is a home located in Cook County with nearby schools including Old Orchard Jr High School, Jane Stenson School, and Niles North High School.
Ownership History
Date
Name
Owned For
Owner Type
Purchase Details
Closed on
Aug 27, 1997
Sold by
Shtivelman Vladimir and Shtivelman Malvina
Bought by
Gil Leslie and Gil Loreta
Current Estimated Value
Home Financials for this Owner
Home Financials are based on the most recent Mortgage that was taken out on this home.
Original Mortgage
$88,900
Interest Rate
7.65%
Purchase Details
Closed on
Jun 12, 1997
Sold by
Lenetzky Theodore L and Lenetzky Carol L
Bought by
Molochnikov Grigoriy and Molochnikov Yelena
Home Financials for this Owner
Home Financials are based on the most recent Mortgage that was taken out on this home.
Original Mortgage
$94,400
Interest Rate
7.75%
Create a Home Valuation Report for This Property
The Home Valuation Report is an in-depth analysis detailing your home's value as well as a comparison with similar homes in the area
Home Values in the Area
Average Home Value in this Area
Purchase History
| Date | Buyer | Sale Price | Title Company |
|---|---|---|---|
| Gil Leslie | $84,666 | Attorneys Natl Title Network | |
| Molochnikov Grigoriy | $118,000 | Attorneys Natl Title Network |
Source: Public Records
Mortgage History
| Date | Status | Borrower | Loan Amount |
|---|---|---|---|
| Previous Owner | Gil Leslie | $88,900 | |
| Previous Owner | Molochnikov Grigoriy | $94,400 |
Source: Public Records
Tax History Compared to Growth
Tax History
| Year | Tax Paid | Tax Assessment Tax Assessment Total Assessment is a certain percentage of the fair market value that is determined by local assessors to be the total taxable value of land and additions on the property. | Land | Improvement |
|---|---|---|---|---|
| 2024 | $4,005 | $22,000 | $4,000 | $18,000 |
| 2023 | $3,852 | $22,000 | $4,000 | $18,000 |
| 2022 | $3,852 | $22,000 | $4,000 | $18,000 |
| 2021 | $3,269 | $17,938 | $1,386 | $16,552 |
| 2020 | $4,020 | $17,938 | $1,386 | $16,552 |
| 2019 | $4,121 | $20,155 | $1,386 | $18,769 |
| 2018 | $3,924 | $18,002 | $1,256 | $16,746 |
| 2017 | $3,969 | $18,002 | $1,256 | $16,746 |
| 2016 | $4,023 | $18,002 | $1,256 | $16,746 |
| 2015 | $3,626 | $15,615 | $1,083 | $14,532 |
| 2014 | $3,557 | $15,615 | $1,083 | $14,532 |
| 2013 | $3,532 | $15,615 | $1,083 | $14,532 |
Source: Public Records
Map
Nearby Homes
- 8836 Bronx Ave
- 8940 Lamon Ave
- 9011 Bronx Ave
- 5128 Suffield Ct
- 9012 Lamon Ave
- 8914 La Crosse Ave Unit 2S
- 8847 La Crosse Ave Unit 204
- 4801 Grove St
- 4901 Carol Unit F St
- 4949 Church St Unit 107
- 5247 Suffield Ct
- 4735 Grove St Unit 103
- 8717 Gross Point Rd
- 8710 Skokie Blvd Unit 3BS
- 4820 Conrad St Unit 101
- 8644 Skokie Blvd
- 5352 Greenwood St
- 8605 Laramie Ave
- 5109 Greenleaf St
- 8534 Terminal Ave
- 5015 Suffield Ct
- 5015 Suffield Ct
- 5015 Suffield Ct Unit B
- 5015 Suffield Ct Unit W
- 5021 Suffield Ct
- 5021 Suffield Ct
- 5021 Suffield Ct
- 5021 Suffield Ct
- 5021 Suffield Ct Unit D
- 5021 Suffield Ct Unit B
- 5021 Suffield Ct Unit C
- 5025 Suffield Ct
- 5025 Suffield Ct
- 5025 Suffield Ct
- 5025 Suffield Ct
- 5025 Suffield Ct
- 5025 Suffield Ct Unit C
- 5025 Suffield Ct Unit A
- 8918 Lavergne Ave Unit 2N