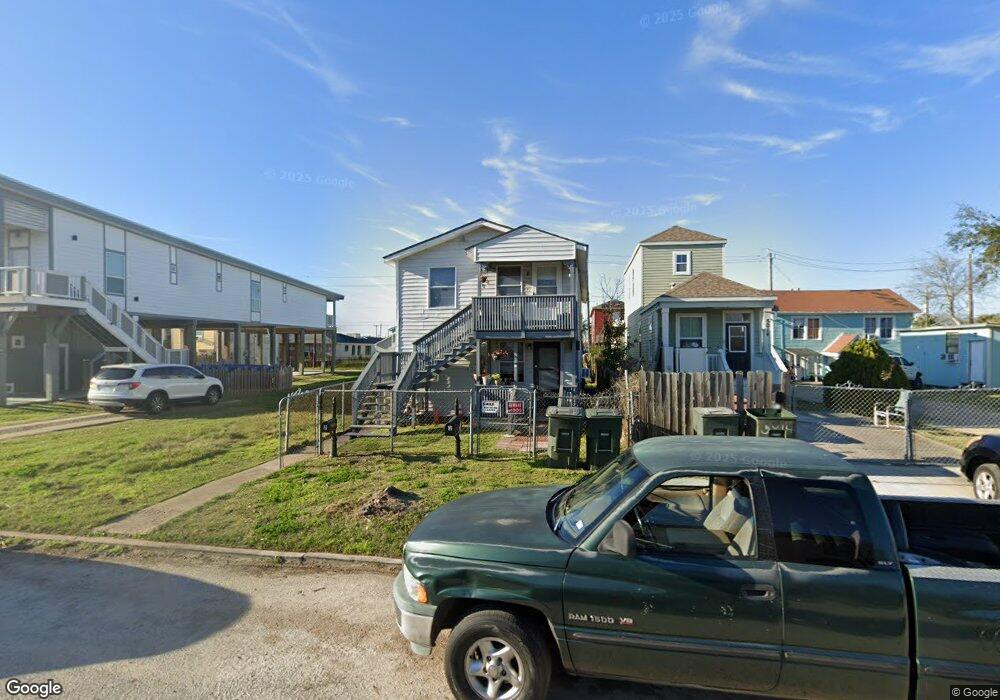
5016 Avenue m 1/2 Unit Down Galveston, TX 77551
Lasker Park NeighborhoodEstimated Value: $244,000 - $352,000
2
Beds
1
Bath
1,115
Sq Ft
$267/Sq Ft
Est. Value
About This Home
This home is located at 5016 Avenue m 1/2 Unit Down, Galveston, TX 77551 and is currently estimated at $297,736, approximately $267 per square foot. 5016 Avenue m 1/2 Unit Down is a home located in Galveston County with nearby schools including Burnet STREAM Magnet School, Morgan Elementary Magnet School, and Parker Elementary School.
Ownership History
Date
Name
Owned For
Owner Type
Purchase Details
Closed on
Jun 24, 2010
Sold by
Coleman Samuel and Coleman Bobbye
Bought by
Mills Bobbye N and Mills Melvyn D
Current Estimated Value
Purchase Details
Closed on
Aug 3, 2007
Sold by
Tow Rodney
Bought by
Coleman Samuel and Coleman Bobbye
Home Financials for this Owner
Home Financials are based on the most recent Mortgage that was taken out on this home.
Original Mortgage
$89,550
Interest Rate
6.69%
Mortgage Type
Commercial
Purchase Details
Closed on
Nov 7, 2002
Sold by
Mills Melvyn Douglas
Bought by
Mills Melvyn Douglas and Mills Bobbye Branch
Purchase Details
Closed on
Jul 18, 1997
Sold by
Kaechler Carson Wayne
Bought by
Kaechler Betty L
Create a Home Valuation Report for This Property
The Home Valuation Report is an in-depth analysis detailing your home's value as well as a comparison with similar homes in the area
Home Values in the Area
Average Home Value in this Area
Purchase History
| Date | Buyer | Sale Price | Title Company |
|---|---|---|---|
| Mills Bobbye N | -- | None Available | |
| Coleman Samuel | -- | First American Title | |
| Mills Melvyn Douglas | -- | -- | |
| Kaechler Betty L | -- | -- |
Source: Public Records
Mortgage History
| Date | Status | Borrower | Loan Amount |
|---|---|---|---|
| Previous Owner | Coleman Samuel | $89,550 | |
| Closed | Mills Bobbye N | $0 |
Source: Public Records
Tax History Compared to Growth
Tax History
| Year | Tax Paid | Tax Assessment Tax Assessment Total Assessment is a certain percentage of the fair market value that is determined by local assessors to be the total taxable value of land and additions on the property. | Land | Improvement |
|---|---|---|---|---|
| 2025 | $4,925 | $284,573 | $53,250 | $231,323 |
| 2024 | $4,925 | $284,573 | $53,250 | $231,323 |
| 2023 | $4,925 | $334,760 | $36,750 | $298,010 |
| 2022 | $4,436 | $220,050 | $36,750 | $183,300 |
| 2021 | $4,272 | $188,850 | $36,750 | $152,100 |
| 2020 | $3,741 | $156,110 | $12,380 | $143,730 |
| 2019 | $3,666 | $148,660 | $12,380 | $136,280 |
| 2018 | $3,725 | $150,520 | $12,380 | $138,140 |
| 2017 | $3,725 | $152,370 | $12,380 | $139,990 |
| 2016 | $2,812 | $115,000 | $12,380 | $102,620 |
| 2015 | $2,444 | $103,760 | $12,380 | $91,380 |
| 2014 | $1,429 | $57,000 | $12,380 | $44,620 |
Source: Public Records
Map
Nearby Homes
- 5016 Avenue m 1/2
- 5014 Avenue m 1/2
- 5018 Avenue m 1/2
- 5004 Avenue M 1 2
- 5018 Avenue M 1 2
- 5004 Avenue m 1/2 Rear
- 5002 Avenue m 1/2
- 5024 Avenue m 1/2
- 5019 Avenue M 1 2 Efficiency
- 5007 Avenue M
- 5011 Avenue M
- 5015 Avenue M
- 5019 Avenue m 1/2
- 5005 Avenue M
- 1314 51st St
- 1401 50th St
- 1318 51st St
- 1328 50th St
- 1405 50th St
- 1304 51st St