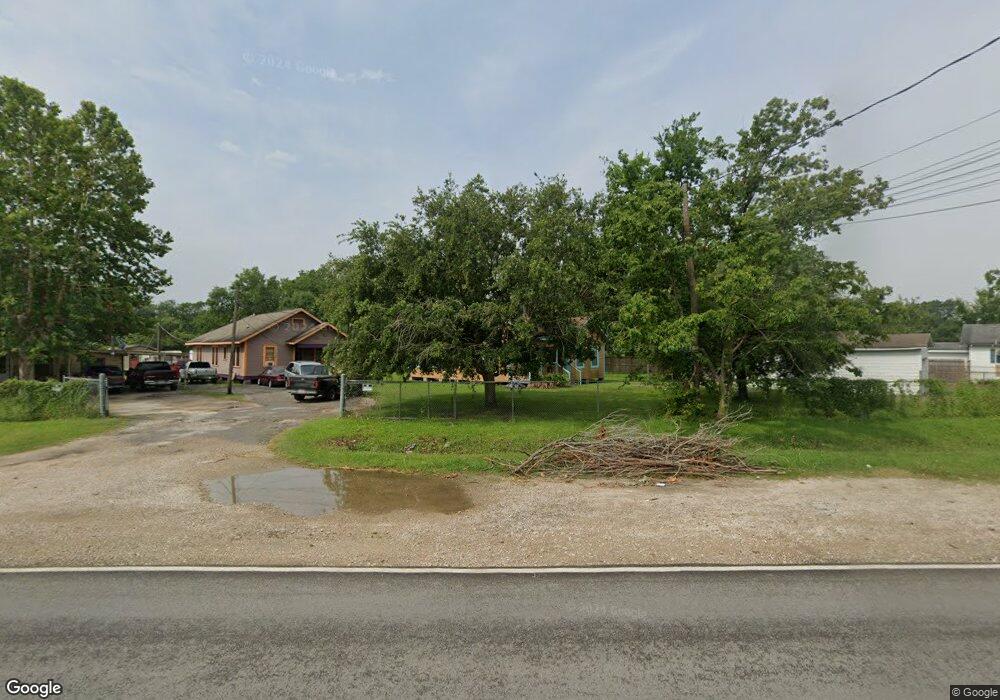
5016 Bennington St Houston, TX 77028
Trinity-Houston Gardens NeighborhoodEstimated Value: $148,407 - $193,000
2
Beds
1
Bath
956
Sq Ft
$174/Sq Ft
Est. Value
About This Home
This home is located at 5016 Bennington St, Houston, TX 77028 and is currently estimated at $166,602, approximately $174 per square foot. 5016 Bennington St is a home located in Harris County with nearby schools including Felix Cook Jr. Elementary School, Key Middle, and Kashmere High School.
Ownership History
Date
Name
Owned For
Owner Type
Purchase Details
Closed on
Aug 10, 2016
Sold by
Martin Shona
Bought by
Everage Sherri
Current Estimated Value
Purchase Details
Closed on
Nov 19, 2012
Sold by
Gentry Melvin and Gentry Isiah
Bought by
Martin Shuna P
Purchase Details
Closed on
Oct 13, 2012
Sold by
Gentry Melvin and Irving Deborah
Bought by
Martin Shuna P
Create a Home Valuation Report for This Property
The Home Valuation Report is an in-depth analysis detailing your home's value as well as a comparison with similar homes in the area
Home Values in the Area
Average Home Value in this Area
Purchase History
| Date | Buyer | Sale Price | Title Company |
|---|---|---|---|
| Everage Sherri | -- | None Available | |
| Martin Shuna P | -- | None Available | |
| Martin Shuna P | -- | None Available |
Source: Public Records
Tax History Compared to Growth
Tax History
| Year | Tax Paid | Tax Assessment Tax Assessment Total Assessment is a certain percentage of the fair market value that is determined by local assessors to be the total taxable value of land and additions on the property. | Land | Improvement |
|---|---|---|---|---|
| 2025 | $2,583 | $131,891 | $67,050 | $64,841 |
| 2024 | $2,583 | $123,461 | $67,050 | $56,411 |
| 2023 | $2,346 | $116,461 | $67,050 | $49,411 |
| 2022 | $2,055 | $93,348 | $53,640 | $39,708 |
| 2021 | $1,924 | $82,545 | $33,525 | $49,020 |
| 2020 | $1,661 | $68,578 | $26,820 | $41,758 |
| 2019 | $1,424 | $56,275 | $18,104 | $38,171 |
| 2018 | $1,254 | $49,562 | $14,751 | $34,811 |
| 2017 | $1,253 | $49,562 | $14,751 | $34,811 |
| 2016 | $1,188 | $46,980 | $14,751 | $32,229 |
| 2015 | $1,080 | $42,023 | $14,751 | $27,272 |
| 2014 | $1,080 | $42,023 | $14,751 | $27,272 |
Source: Public Records
Map
Nearby Homes
- 6605 Lockwood Dr
- 0 Lynnfield St
- 00 Lynnfield St
- 4843 Shreveport Blvd
- 4811 Shreveport Blvd
- 4807 Shreveport Blvd
- 5017 Baton Rouge St
- 6713 Shotwell St
- 6112 Shotwell St
- 6309 Sandra St
- 7210 Lockwood Dr Unit 1
- 6307 Sandra St
- 6305 Sandra St Unit A/B
- 5420 Lynnfield St Unit A/B
- 6713 Hoffman St
- 4605 Baton Rouge St
- 4603 Baton Rouge St
- 4616 Shreveport Blvd
- 6520 Hoffman St
- 5317 Caplin St
- 5026 Bennington St
- 5018 Bennington St
- 5032 Bennington St
- 5014 Bennington St
- 6705 Wileyvale Rd
- 5010 Bennington St
- 6712 Lockwood Dr
- 6718 Lockwood Dr
- 6625 Wileyvale Rd
- 6722 Lockwood Dr
- 6709 Lockwood
- 6708 Lockwood Dr
- 6716 Lockwood Dr
- 6619 Wileyvale Rd
- 6616 Lockwood Dr
- 5102 Bennington St
- 6704 Lockwood Dr
- 6615 Wileyvale Rd
- 6423 Lockwood Dr
- 5108 Bennington St