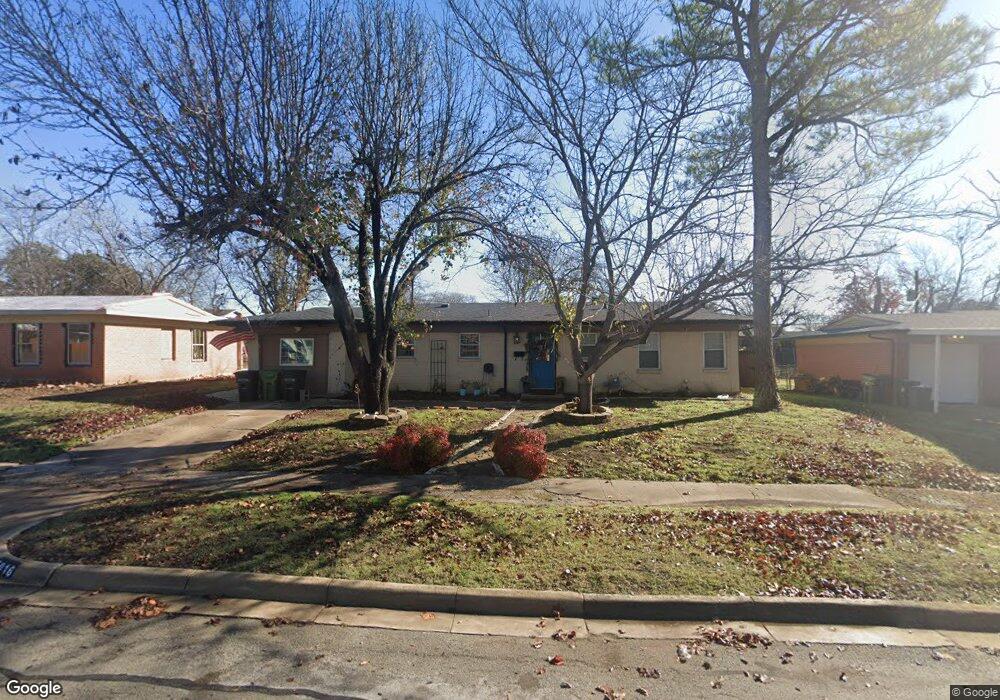
5016 Colorado Blvd North Richland Hills, TX 76180
Estimated Value: $239,615 - $300,000
3
Beds
1
Bath
1,479
Sq Ft
$179/Sq Ft
Est. Value
About This Home
This home is located at 5016 Colorado Blvd, North Richland Hills, TX 76180 and is currently estimated at $264,904, approximately $179 per square foot. 5016 Colorado Blvd is a home located in Tarrant County with nearby schools including Jack C Binion Elementary School, Richland Middle School, and Birdville High School.
Ownership History
Date
Name
Owned For
Owner Type
Purchase Details
Closed on
May 31, 2002
Sold by
Anacortas Investments Inc
Bought by
Carlson Cristine S
Current Estimated Value
Home Financials for this Owner
Home Financials are based on the most recent Mortgage that was taken out on this home.
Original Mortgage
$79,748
Outstanding Balance
$33,910
Interest Rate
6.89%
Mortgage Type
FHA
Estimated Equity
$230,994
Purchase Details
Closed on
Feb 7, 2002
Sold by
Kozak Teresa Ann Lamascus and Kozak Dirk
Bought by
Anacortas Investments Inc
Home Financials for this Owner
Home Financials are based on the most recent Mortgage that was taken out on this home.
Original Mortgage
$42,500
Interest Rate
7.15%
Purchase Details
Closed on
Oct 16, 1995
Sold by
Brents Carylon Jane
Bought by
Stabler Teresa Ann Lamascus
Create a Home Valuation Report for This Property
The Home Valuation Report is an in-depth analysis detailing your home's value as well as a comparison with similar homes in the area
Home Values in the Area
Average Home Value in this Area
Purchase History
| Date | Buyer | Sale Price | Title Company |
|---|---|---|---|
| Carlson Cristine S | -- | Stewart Title | |
| Anacortas Investments Inc | -- | American Title Co | |
| Stabler Teresa Ann Lamascus | $4,000 | -- |
Source: Public Records
Mortgage History
| Date | Status | Borrower | Loan Amount |
|---|---|---|---|
| Open | Carlson Cristine S | $79,748 | |
| Previous Owner | Anacortas Investments Inc | $42,500 | |
| Closed | Stabler Teresa Ann Lamascus | $0 |
Source: Public Records
Tax History Compared to Growth
Tax History
| Year | Tax Paid | Tax Assessment Tax Assessment Total Assessment is a certain percentage of the fair market value that is determined by local assessors to be the total taxable value of land and additions on the property. | Land | Improvement |
|---|---|---|---|---|
| 2025 | $2,297 | $215,383 | $55,000 | $160,383 |
| 2024 | $2,297 | $215,383 | $55,000 | $160,383 |
| 2023 | $3,494 | $216,815 | $55,000 | $161,815 |
| 2022 | $3,484 | $182,744 | $25,000 | $157,744 |
| 2021 | $3,349 | $150,822 | $25,000 | $125,822 |
| 2020 | $3,045 | $130,173 | $25,000 | $105,173 |
| 2019 | $2,865 | $108,784 | $25,000 | $83,784 |
| 2018 | $2,293 | $104,350 | $25,000 | $79,350 |
| 2017 | $2,552 | $121,458 | $25,000 | $96,458 |
| 2016 | $2,320 | $118,846 | $15,000 | $103,846 |
| 2015 | $1,819 | $78,400 | $12,000 | $66,400 |
| 2014 | $1,819 | $78,400 | $12,000 | $66,400 |
Source: Public Records
Map
Nearby Homes
- 5020 Colorado Blvd
- 8020 Laura St
- 5016 Wyoming Trail
- 5113 Bob Dr
- 7908 Lazy Lane Rd
- 5304 Colorado Blvd
- 7717 Janetta Dr
- 8417 Emerald Cir
- 5336 Davis Blvd
- 4916 Susan Lee Ln
- 8304 Emerald Cir
- 7800 Arnold Terrace
- 5024 Maryanna Way
- 5117 Maryanna Way
- Dalton II Plan at City Point
- Zoe Plan at City Point
- Hampton Plan at City Point
- Conrad Plan at City Point
- 4304 Lynn Terrace
- 5320 Topper Dr
- 5012 Colorado Blvd
- 5017 Wyoming Trail
- 5013 Wyoming Trail
- 5024 Colorado Blvd
- 8028 Laura St
- 5009 Wyoming Trail
- 5025 Wyoming Trail
- 5028 Colorado Blvd
- 5004 Colorado Blvd
- 8033 Laura St
- 8024 Laura St
- 5005 Wyoming Trail
- 8029 Laura St
- 5000 Colorado Blvd
- 5001 Colorado Blvd
- 5012 Wyoming Trail
- 5020 Wyoming Trail
- 5001 Wyoming Trail
- 5033 Wyoming Trail