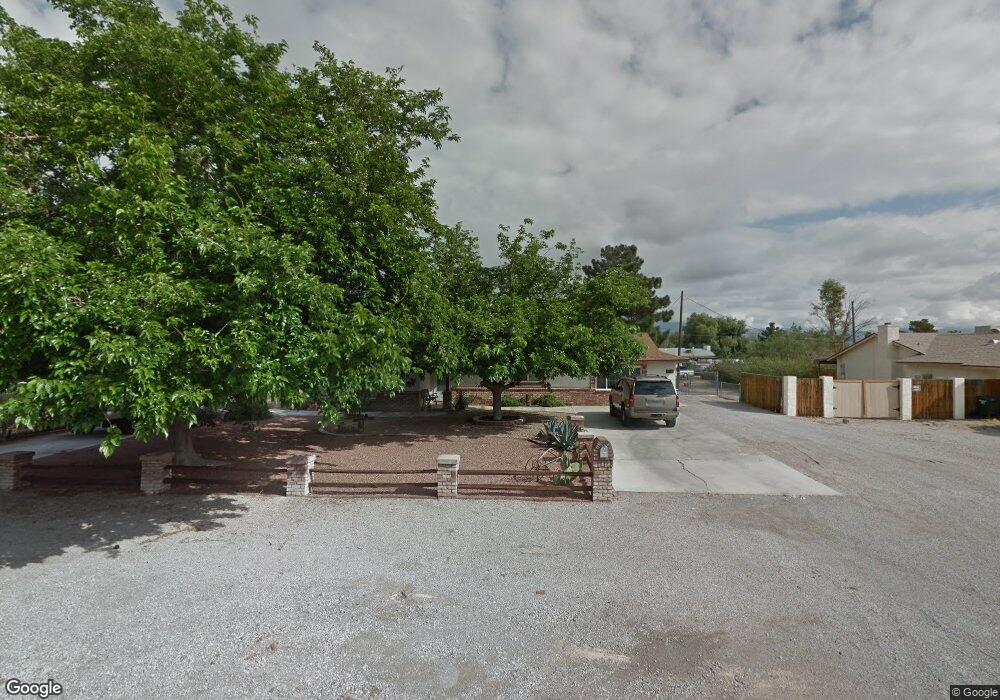
5016 Jay Ave Las Vegas, NV 89130
Northwest Area NeighborhoodEstimated Value: $435,000 - $586,000
3
Beds
2
Baths
1,484
Sq Ft
$334/Sq Ft
Est. Value
About This Home
This home is located at 5016 Jay Ave, Las Vegas, NV 89130 and is currently estimated at $495,588, approximately $333 per square foot. 5016 Jay Ave is a home located in Clark County with nearby schools including Claude & Stella Parson Elementary School, Theron L Swainston Middle School, and Cheyenne High School.
Ownership History
Date
Name
Owned For
Owner Type
Purchase Details
Closed on
Jul 25, 2002
Sold by
Snyder Daniel Fred and Snyder Darlene E
Bought by
Garber Clinton and Garber Margaret
Current Estimated Value
Home Financials for this Owner
Home Financials are based on the most recent Mortgage that was taken out on this home.
Original Mortgage
$130,000
Interest Rate
6.6%
Purchase Details
Closed on
Dec 28, 1998
Sold by
Snyder Daniel Fred and Snyder Darlene E
Bought by
Snyder Daniel Fred and Snyder Darlene E
Home Financials for this Owner
Home Financials are based on the most recent Mortgage that was taken out on this home.
Original Mortgage
$74,600
Interest Rate
6.82%
Mortgage Type
VA
Create a Home Valuation Report for This Property
The Home Valuation Report is an in-depth analysis detailing your home's value as well as a comparison with similar homes in the area
Home Values in the Area
Average Home Value in this Area
Purchase History
| Date | Buyer | Sale Price | Title Company |
|---|---|---|---|
| Garber Clinton | $162,500 | United Title | |
| Snyder Daniel Fred | -- | Fidelity National Title |
Source: Public Records
Mortgage History
| Date | Status | Borrower | Loan Amount |
|---|---|---|---|
| Closed | Garber Clinton | $130,000 | |
| Previous Owner | Snyder Daniel Fred | $74,600 | |
| Closed | Garber Clinton | $32,500 |
Source: Public Records
Tax History Compared to Growth
Tax History
| Year | Tax Paid | Tax Assessment Tax Assessment Total Assessment is a certain percentage of the fair market value that is determined by local assessors to be the total taxable value of land and additions on the property. | Land | Improvement |
|---|---|---|---|---|
| 2025 | $1,932 | $76,545 | $47,250 | $29,295 |
| 2024 | $1,789 | $76,545 | $47,250 | $29,295 |
| 2023 | $1,789 | $76,323 | $47,250 | $29,073 |
| 2022 | $1,657 | $71,171 | $43,750 | $27,421 |
| 2021 | $1,535 | $68,720 | $42,000 | $26,720 |
| 2020 | $1,422 | $65,647 | $38,500 | $27,147 |
| 2019 | $1,333 | $53,643 | $26,250 | $27,393 |
| 2018 | $1,272 | $49,706 | $22,750 | $26,956 |
| 2017 | $1,191 | $48,874 | $21,000 | $27,874 |
| 2016 | $1,191 | $43,556 | $14,700 | $28,856 |
| 2015 | $1,188 | $42,971 | $14,000 | $28,971 |
| 2014 | $1,153 | $42,922 | $14,000 | $28,922 |
Source: Public Records
Map
Nearby Homes
- 5025 Jay Ave
- 3413 Bonn Ct
- 4905 Ricky Rd
- 3711 Thom Blvd
- 5008 Donnie Ave
- 3500 N Rancho Dr
- 3509 Golden Sage Dr
- 3801 Hidden Plateau St
- 5105 Gentle River Ave
- 3318 N Decatur Blvd Unit 2110
- 3318 N Decatur Blvd Unit 1013
- 3318 N Decatur Blvd Unit 2112
- 3318 N Decatur Blvd Unit 2149
- 3318 N Decatur Blvd Unit 2143
- 3318 N Decatur Blvd Unit 1044
- 3318 N Decatur Blvd Unit 2082
- 3318 N Decatur Blvd Unit 1002
- 3318 N Decatur Blvd Unit 2086
- 3318 N Decatur Blvd Unit 2072
- 3318 N Decatur Blvd Unit 2083