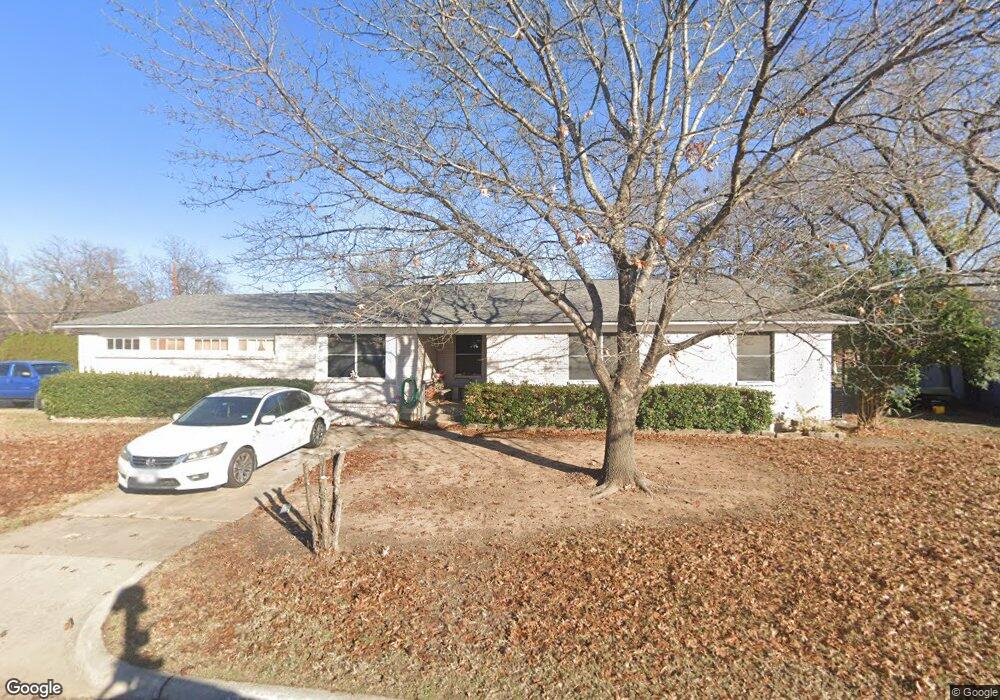
5016 Nancy Ln North Richland Hills, TX 76180
Estimated Value: $268,000 - $281,000
3
Beds
2
Baths
1,440
Sq Ft
$191/Sq Ft
Est. Value
About This Home
This home is located at 5016 Nancy Ln, North Richland Hills, TX 76180 and is currently estimated at $275,413, approximately $191 per square foot. 5016 Nancy Ln is a home located in Tarrant County with nearby schools including Holiday Heights Elementary School, North Richland Middle School, and Richland High School.
Ownership History
Date
Name
Owned For
Owner Type
Purchase Details
Closed on
Feb 4, 2025
Sold by
Andrews Walker Shannon and Andrews Richard Bennett
Bought by
Vermillion Mark Edward
Current Estimated Value
Purchase Details
Closed on
Oct 3, 2000
Sold by
Able House Buyers Inc
Bought by
Vermillion Mark Edward and Vermillion Carol K
Home Financials for this Owner
Home Financials are based on the most recent Mortgage that was taken out on this home.
Original Mortgage
$79,857
Interest Rate
7.99%
Mortgage Type
FHA
Purchase Details
Closed on
May 24, 2000
Sold by
Roach Bernie J and Wacaster Gloria J
Bought by
Able House Buyers Inc
Home Financials for this Owner
Home Financials are based on the most recent Mortgage that was taken out on this home.
Original Mortgage
$225,000
Interest Rate
8.14%
Purchase Details
Closed on
Apr 10, 1995
Sold by
Roach Annie O
Bought by
Roach Annie O and The Trust Of Annie O Roach
Create a Home Valuation Report for This Property
The Home Valuation Report is an in-depth analysis detailing your home's value as well as a comparison with similar homes in the area
Home Values in the Area
Average Home Value in this Area
Purchase History
| Date | Buyer | Sale Price | Title Company |
|---|---|---|---|
| Vermillion Mark Edward | -- | None Listed On Document | |
| Vermillion Mark Edward | -- | Alamo Title Company | |
| Able House Buyers Inc | -- | Alamo Title Company | |
| Roach Annie O | -- | -- |
Source: Public Records
Mortgage History
| Date | Status | Borrower | Loan Amount |
|---|---|---|---|
| Previous Owner | Vermillion Mark Edward | $79,857 | |
| Previous Owner | Able House Buyers Inc | $225,000 |
Source: Public Records
Tax History Compared to Growth
Tax History
| Year | Tax Paid | Tax Assessment Tax Assessment Total Assessment is a certain percentage of the fair market value that is determined by local assessors to be the total taxable value of land and additions on the property. | Land | Improvement |
|---|---|---|---|---|
| 2025 | $1,097 | $246,299 | $50,000 | $196,299 |
| 2024 | $1,097 | $246,299 | $50,000 | $196,299 |
| 2023 | $3,607 | $256,995 | $50,000 | $206,995 |
| 2022 | $3,597 | $218,975 | $30,000 | $188,975 |
| 2021 | $3,458 | $186,038 | $30,000 | $156,038 |
| 2020 | $3,143 | $157,044 | $30,000 | $127,044 |
| 2019 | $2,957 | $144,048 | $30,000 | $114,048 |
| 2018 | $2,235 | $102,088 | $30,000 | $72,088 |
| 2017 | $2,497 | $124,092 | $30,000 | $94,092 |
| 2016 | $2,270 | $116,814 | $20,000 | $96,814 |
| 2015 | $1,775 | $76,700 | $16,000 | $60,700 |
| 2014 | $1,775 | $76,700 | $16,000 | $60,700 |
Source: Public Records
Map
Nearby Homes
- 4916 Susan Lee Ln
- 5024 Maryanna Way
- 7717 Janetta Dr
- 5117 Maryanna Way
- 5016 Winder Ct
- 5320 Topper Dr
- 7409 Jade Cir
- 5336 Davis Blvd
- 7501 Lola Dr
- 7529 Susan Ct
- 7521 Susan Ct
- 5113 Bob Dr
- 7908 Lazy Lane Rd
- 8020 Laura St
- 5020 Colorado Blvd
- 4540 Ward St
- 5016 Wyoming Trail
- Dalton II Plan at City Point
- Zoe Plan at City Point
- Hampton Plan at City Point
- 5012 Nancy Ln
- 5017 Roberta Dr
- 5013 Roberta Dr
- 5008 Nancy Ln
- 5100 Nancy Ln
- 5021 Nancy Ln
- 5017 Nancy Ln
- 5101 Roberta Dr
- 5009 Roberta Dr
- 5013 Nancy Ln
- 5004 Nancy Ln
- 5101 Nancy Ln
- 5104 Nancy Ln
- 5009 Nancy Ln
- 5105 Roberta Dr
- 5005 Roberta Dr
- 5016 Roberta Dr
- 5020 Susan Lee Ln
- 5016 Susan Lee Ln
- 5012 Roberta Dr