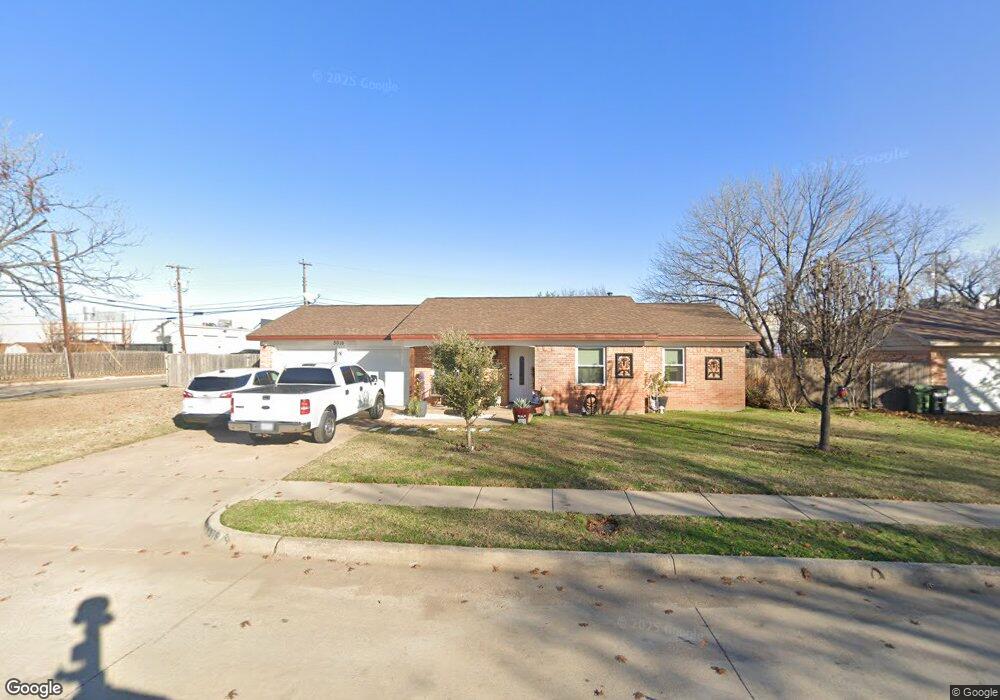
5016 Roberta Dr North Richland Hills, TX 76180
Estimated Value: $214,000 - $261,000
3
Beds
2
Baths
1,036
Sq Ft
$229/Sq Ft
Est. Value
About This Home
This home is located at 5016 Roberta Dr, North Richland Hills, TX 76180 and is currently estimated at $236,934, approximately $228 per square foot. 5016 Roberta Dr is a home located in Tarrant County with nearby schools including Holiday Heights Elementary School, North Richland Middle School, and Richland High School.
Ownership History
Date
Name
Owned For
Owner Type
Purchase Details
Closed on
Mar 16, 2004
Sold by
Turpin Investments Inc
Bought by
Gallegos Oscar
Current Estimated Value
Home Financials for this Owner
Home Financials are based on the most recent Mortgage that was taken out on this home.
Original Mortgage
$81,717
Outstanding Balance
$38,298
Interest Rate
5.71%
Mortgage Type
FHA
Estimated Equity
$198,636
Purchase Details
Closed on
May 9, 1997
Sold by
Shipman Linda G and Shipman Buddy Leslie
Bought by
Blackburn James Oren and Blackburn Norma Sue
Home Financials for this Owner
Home Financials are based on the most recent Mortgage that was taken out on this home.
Original Mortgage
$25,000
Interest Rate
7.97%
Purchase Details
Closed on
Jun 3, 1994
Sold by
Taylor Herbert M and Shipman Linda G
Bought by
Shipman Linda G
Create a Home Valuation Report for This Property
The Home Valuation Report is an in-depth analysis detailing your home's value as well as a comparison with similar homes in the area
Home Values in the Area
Average Home Value in this Area
Purchase History
| Date | Buyer | Sale Price | Title Company |
|---|---|---|---|
| Gallegos Oscar | -- | Fidelity Natl Title Ft Worth | |
| Blackburn James Oren | -- | Ticor Land Title | |
| Shipman Linda G | -- | -- |
Source: Public Records
Mortgage History
| Date | Status | Borrower | Loan Amount |
|---|---|---|---|
| Open | Gallegos Oscar | $81,717 | |
| Previous Owner | Blackburn James Oren | $25,000 |
Source: Public Records
Tax History Compared to Growth
Tax History
| Year | Tax Paid | Tax Assessment Tax Assessment Total Assessment is a certain percentage of the fair market value that is determined by local assessors to be the total taxable value of land and additions on the property. | Land | Improvement |
|---|---|---|---|---|
| 2025 | $4,577 | $175,000 | $50,000 | $125,000 |
| 2024 | $4,577 | $210,918 | $50,000 | $160,918 |
| 2023 | $4,818 | $219,621 | $50,000 | $169,621 |
| 2022 | $4,452 | $184,995 | $30,000 | $154,995 |
| 2021 | $4,027 | $158,253 | $30,000 | $128,253 |
| 2020 | $3,425 | $134,584 | $30,000 | $104,584 |
| 2019 | $3,314 | $125,827 | $30,000 | $95,827 |
| 2018 | $3,044 | $115,592 | $30,000 | $85,592 |
| 2017 | $2,958 | $109,941 | $30,000 | $79,941 |
| 2016 | $2,732 | $101,542 | $20,000 | $81,542 |
| 2015 | $1,727 | $64,300 | $16,000 | $48,300 |
| 2014 | $1,727 | $64,300 | $16,000 | $48,300 |
Source: Public Records
Map
Nearby Homes
- 4916 Susan Lee Ln
- 5024 Maryanna Way
- 7717 Janetta Dr
- 5117 Maryanna Way
- 5016 Winder Ct
- 5336 Davis Blvd
- 5113 Bob Dr
- 7908 Lazy Lane Rd
- 7409 Jade Cir
- 7529 Susan Ct
- 7521 Susan Ct
- 7501 Lola Dr
- 8020 Laura St
- 5020 Colorado Blvd
- 5016 Wyoming Trail
- 5304 Colorado Blvd
- 4540 Ward St
- Dalton II Plan at City Point
- Zoe Plan at City Point
- Hampton Plan at City Point
- 5012 Roberta Dr
- 5008 Roberta Dr
- 5100 Roberta Dr
- 5017 Roberta Dr
- 5013 Roberta Dr
- 7708 Maplewood Ave
- 5009 Roberta Dr
- 5004 Roberta Dr
- 5101 Roberta Dr
- 5104 Roberta Dr
- 5005 Roberta Dr
- 5016 Nancy Ln
- 5012 Nancy Ln
- 5000 Roberta Dr
- 5105 Roberta Dr
- 5008 Nancy Ln
- 5108 Roberta Dr
- 5100 Nancy Ln
- 5001 Roberta Dr
- 5004 Nancy Ln