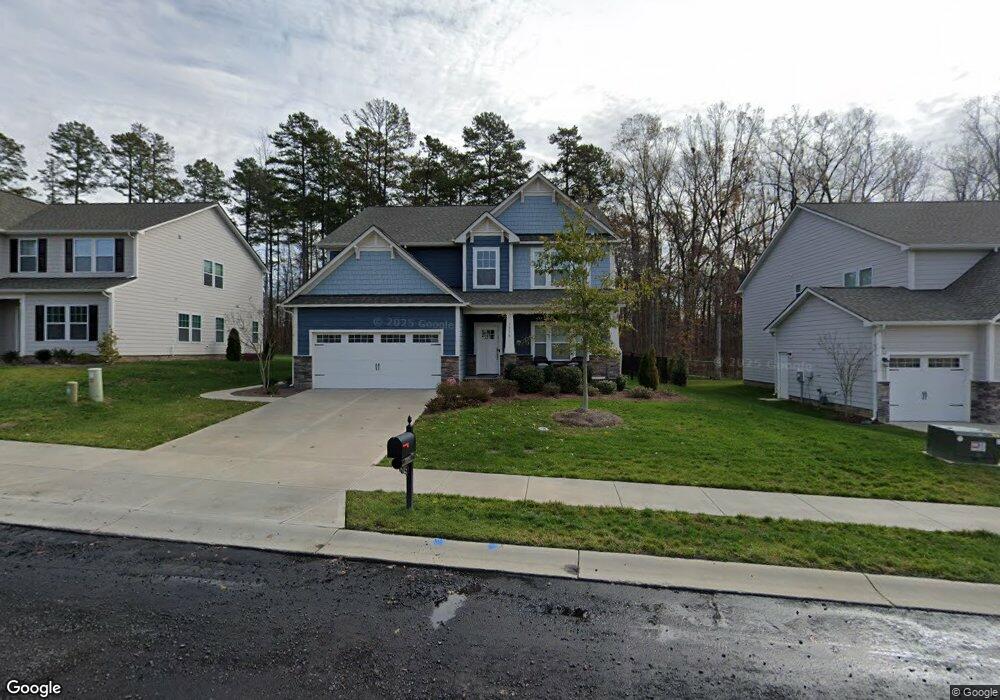
5016 Stonehill Ln Unit 65 Matthews, NC 28104
Estimated Value: $583,000 - $733,000
4
Beds
4
Baths
3,170
Sq Ft
$208/Sq Ft
Est. Value
About This Home
This home is located at 5016 Stonehill Ln Unit 65, Matthews, NC 28104 and is currently estimated at $658,181, approximately $207 per square foot. 5016 Stonehill Ln Unit 65 is a home located in Union County with nearby schools including Indian Trail Elementary School, Sun Valley Middle School, and Sun Valley High School.
Ownership History
Date
Name
Owned For
Owner Type
Purchase Details
Closed on
Jun 6, 2019
Sold by
Glazer Renee Arlene and Glazer Steven Marc
Bought by
Brown Wiley and Brown Constance S
Current Estimated Value
Purchase Details
Closed on
Apr 6, 2018
Sold by
Williams Development Group Llc
Bought by
Glazer Steven Marc and Glazer Renee
Home Financials for this Owner
Home Financials are based on the most recent Mortgage that was taken out on this home.
Original Mortgage
$294,176
Interest Rate
4.43%
Mortgage Type
New Conventional
Purchase Details
Closed on
Sep 22, 2014
Sold by
Carolina Development Services Llc
Bought by
True Homes Llc
Home Financials for this Owner
Home Financials are based on the most recent Mortgage that was taken out on this home.
Original Mortgage
$5,000,000
Interest Rate
4.17%
Mortgage Type
Construction
Create a Home Valuation Report for This Property
The Home Valuation Report is an in-depth analysis detailing your home's value as well as a comparison with similar homes in the area
Home Values in the Area
Average Home Value in this Area
Purchase History
| Date | Buyer | Sale Price | Title Company |
|---|---|---|---|
| Brown Wiley | $380,000 | Austin Title Llc | |
| Glazer Steven Marc | $368,000 | Fidelity National Title Com | |
| True Homes Llc | $280,000 | None Available |
Source: Public Records
Mortgage History
| Date | Status | Borrower | Loan Amount |
|---|---|---|---|
| Previous Owner | Glazer Steven Marc | $294,176 | |
| Previous Owner | True Homes Llc | $5,000,000 |
Source: Public Records
Tax History Compared to Growth
Tax History
| Year | Tax Paid | Tax Assessment Tax Assessment Total Assessment is a certain percentage of the fair market value that is determined by local assessors to be the total taxable value of land and additions on the property. | Land | Improvement |
|---|---|---|---|---|
| 2024 | $3,614 | $413,600 | $84,900 | $328,700 |
| 2023 | $3,466 | $413,600 | $84,900 | $328,700 |
| 2022 | $3,445 | $413,600 | $84,900 | $328,700 |
| 2021 | $3,442 | $413,600 | $84,900 | $328,700 |
| 2020 | $2,739 | $269,100 | $52,000 | $217,100 |
| 2019 | $2,727 | $269,100 | $52,000 | $217,100 |
| 2018 | $2,727 | $269,100 | $52,000 | $217,100 |
| 2017 | $3,062 | $288,300 | $52,000 | $236,300 |
| 2016 | $3,021 | $288,300 | $52,000 | $236,300 |
| 2015 | $2,127 | $288,300 | $52,000 | $236,300 |
| 2014 | -- | $0 | $0 | $0 |
Source: Public Records
Map
Nearby Homes
- 5034 Stonehill Ln
- 2011 Trailwood Dr
- 7017 Holly Grove Ct
- 3678 Privette Rd Unit 349
- 1227 Clover Ln
- 4121 Cedar Point Ave
- 3724 Privette Rd Unit 5
- 4148 Cedar Point Ave
- 2034 Laney Pond Rd
- 1024 Kensrowe Ln
- 1046 Serel Dr
- 1348 Millbank Dr
- 1009 Murandy Ln
- 0000 Chestnut Ln
- 2029 Gable Way Ln
- 2065 Gable Way Ln
- 2044 Gable Way Ln
- 1136 Hammond Dr
- 2004 Viscount Dr
- 1000 Sudbury Ln
- 5016 Stonehill Ln
- 5018 Stonehill Ln
- 5014 Stonehill Ln Unit 64
- 5014 Stonehill Ln
- 5020 Stonehill Ln
- 2002 Trailwood Dr
- 2031 Trailwood Dr
- 2039 Trailwood Dr
- 2011 Trailwood Dr Unit 20
- 1103 Clover Ln
- 5024 Stonehill Ln Unit 68
- 5024 Stonehill Ln
- 1102 Clover Ln Unit 63
- 1102 Clover Ln
- 1107 Clover Ln Unit 38
- 5026 Stonehill Ln Unit 69
- 5026 Stonehill Ln
- 1201 Clover Ln
- 1104 Clover Ln Unit 62
- 1104 Clover Ln