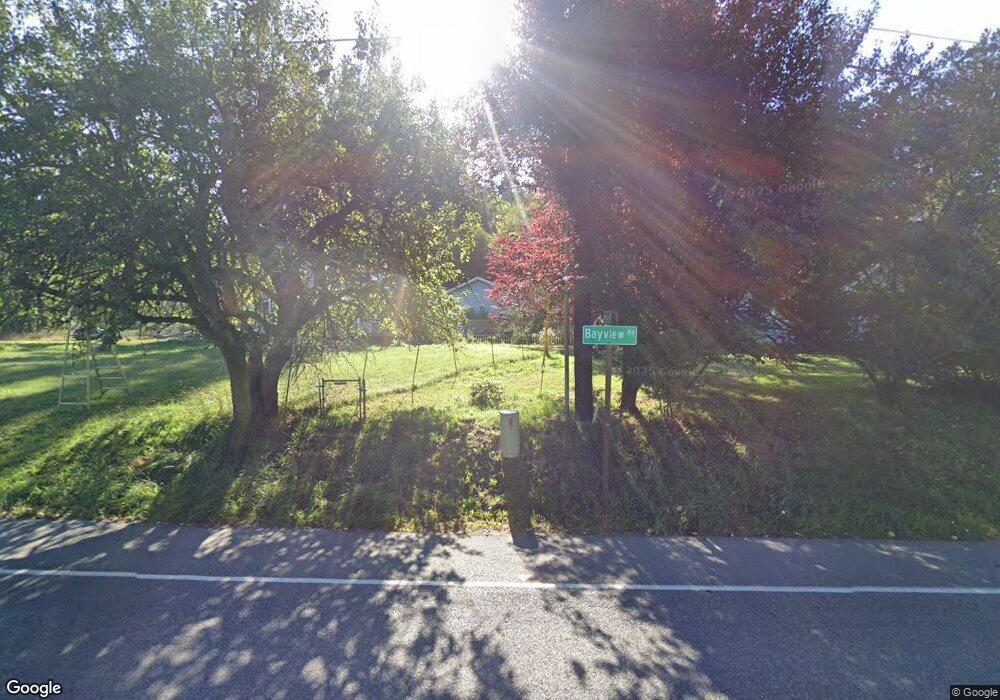
5017 Bayview Rd Langley, WA 98260
Estimated Value: $652,000 - $3,578,000
3
Beds
1
Bath
1,600
Sq Ft
$1,320/Sq Ft
Est. Value
About This Home
This home is located at 5017 Bayview Rd, Langley, WA 98260 and is currently estimated at $2,111,404, approximately $1,319 per square foot. 5017 Bayview Rd is a home located in Island County with nearby schools including South Whidbey Elementary School, South Whidbey Middle School, and South Whidbey High School.
Ownership History
Date
Name
Owned For
Owner Type
Purchase Details
Closed on
May 23, 2025
Sold by
Williamson Brock
Bought by
Williamson Casey and Williamson Krista L
Current Estimated Value
Purchase Details
Closed on
Apr 30, 2019
Sold by
Williamson Brock
Bought by
Williamson Brock
Home Financials for this Owner
Home Financials are based on the most recent Mortgage that was taken out on this home.
Original Mortgage
$247,000
Interest Rate
4%
Mortgage Type
New Conventional
Create a Home Valuation Report for This Property
The Home Valuation Report is an in-depth analysis detailing your home's value as well as a comparison with similar homes in the area
Home Values in the Area
Average Home Value in this Area
Purchase History
| Date | Buyer | Sale Price | Title Company |
|---|---|---|---|
| Williamson Casey | $313 | None Listed On Document | |
| Williamson Brock | $2,163,764 | None Available |
Source: Public Records
Mortgage History
| Date | Status | Borrower | Loan Amount |
|---|---|---|---|
| Previous Owner | Williamson Brock | $247,000 |
Source: Public Records
Tax History
| Year | Tax Paid | Tax Assessment Tax Assessment Total Assessment is a certain percentage of the fair market value that is determined by local assessors to be the total taxable value of land and additions on the property. | Land | Improvement |
|---|---|---|---|---|
| 2025 | $3,925 | $569,179 | $380,000 | $189,179 |
| 2024 | $3,470 | $542,485 | $350,000 | $192,485 |
| 2023 | $3,470 | $525,793 | $330,000 | $195,793 |
| 2022 | $3,164 | $472,459 | $290,000 | $182,459 |
| 2021 | $2,451 | $394,259 | $230,000 | $164,259 |
| 2020 | $2,652 | $309,896 | $190,000 | $119,896 |
| 2019 | $2,368 | $345,195 | $250,000 | $95,195 |
| 2018 | $2,395 | $305,633 | $210,000 | $95,633 |
| 2017 | $1,792 | $286,509 | $190,000 | $96,509 |
| 2016 | $1,862 | $233,259 | $135,000 | $98,259 |
| 2015 | -- | $235,010 | $135,000 | $100,010 |
| 2013 | -- | $207,015 | $114,210 | $92,805 |
Source: Public Records
Map
Nearby Homes
- 4976 Carlie Dr
- 4955 Wheel Dr
- 4958 Wheel Dr
- 0 April Dr
- 5427 Bayview Rd
- 0 XXX Coles Rd
- 4865 Saratoga Rd
- 0 Primavera Place
- 4887 Lakeside Dr
- 5265 Lakeside Dr
- 5777 Kramer Rd
- 4935 Helppie Ln
- 683 3rd St Unit 1(A)
- 0 Kramer Rd Unit NWM2475719
- 0 Captain Vancouver Dr Unit NWM2442158
- 624 A, B & C 2nd St
- 730 Gleason Ln
- 1043 Village Loop
- 4610 Cedar Hill Rd
- 424 Island View Ln
- 5025 Bayview Rd
- 3175 E Andreason Rd
- 5028 Bayview Rd
- 3019 Andreason Rd
- 4950 Wheel Dr
- 2990 Andreason Rd
- 5062 Wynter Place
- 4988 Wheel Dr
- 4984 Wheel Dr
- 5001 Bayview Rd
- 4978 Wheel Dr
- 4977 Wheel Dr
- 4983 Carlie Dr
- 4974 Wheel Dr
- 5055 Bayview Rd
- 2968 Andreason Rd
- 4968 Wheel Dr
- 5049 Wynter Place
- 4969 Wheel Dr
- 4973 Carlie Dr
Your Personal Tour Guide
Ask me questions while you tour the home.