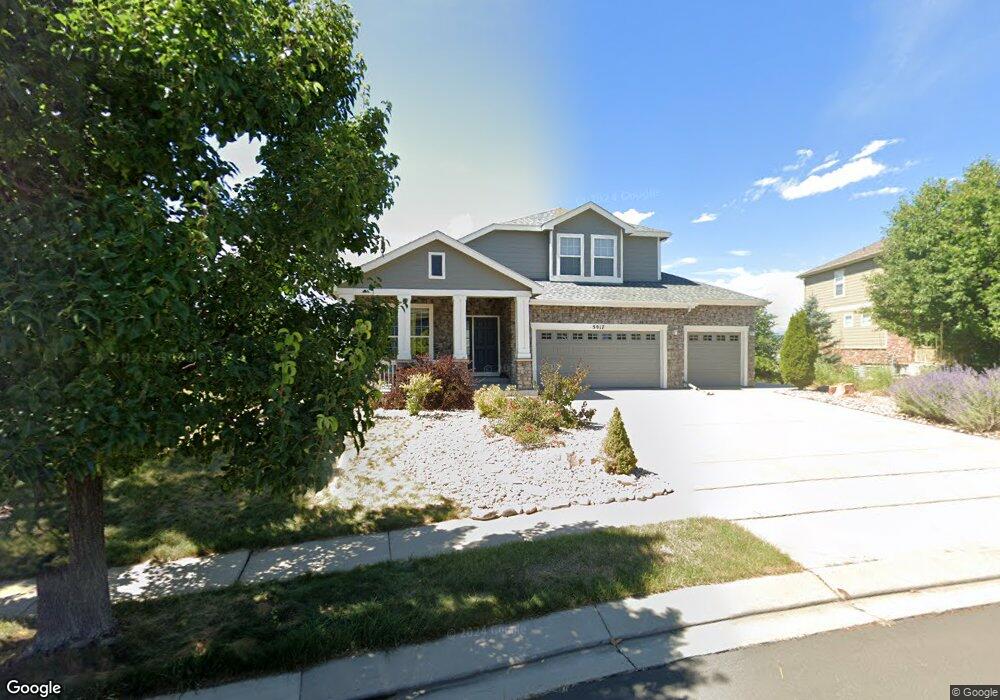
5017 Buffalo Grass Loop Broomfield, CO 80023
North Broomfield NeighborhoodEstimated Value: $921,120 - $1,108,000
4
Beds
3
Baths
3,309
Sq Ft
$302/Sq Ft
Est. Value
About This Home
This home is located at 5017 Buffalo Grass Loop, Broomfield, CO 80023 and is currently estimated at $998,030, approximately $301 per square foot. 5017 Buffalo Grass Loop is a home located in Broomfield County with nearby schools including Coyote Ridge Elementary School, Westlake Middle School, and Legacy High School.
Ownership History
Date
Name
Owned For
Owner Type
Purchase Details
Closed on
Jul 18, 2012
Sold by
Nehring Michael J
Bought by
Brakey Dow Nathan Glenn and Brakey Dow Kristin
Current Estimated Value
Home Financials for this Owner
Home Financials are based on the most recent Mortgage that was taken out on this home.
Original Mortgage
$396,000
Outstanding Balance
$273,741
Interest Rate
3.7%
Mortgage Type
New Conventional
Estimated Equity
$724,289
Purchase Details
Closed on
Jun 18, 2007
Sold by
Standard Pacific Of Colorado Inc
Bought by
Nehring Michael J
Home Financials for this Owner
Home Financials are based on the most recent Mortgage that was taken out on this home.
Original Mortgage
$405,650
Interest Rate
6.16%
Mortgage Type
Purchase Money Mortgage
Create a Home Valuation Report for This Property
The Home Valuation Report is an in-depth analysis detailing your home's value as well as a comparison with similar homes in the area
Home Values in the Area
Average Home Value in this Area
Purchase History
| Date | Buyer | Sale Price | Title Company |
|---|---|---|---|
| Brakey Dow Nathan Glenn | $495,000 | Land Title Guarantee Company | |
| Nehring Michael J | $507,101 | Land Title Guarantee Company |
Source: Public Records
Mortgage History
| Date | Status | Borrower | Loan Amount |
|---|---|---|---|
| Open | Brakey Dow Nathan Glenn | $396,000 | |
| Previous Owner | Nehring Michael J | $405,650 |
Source: Public Records
Tax History Compared to Growth
Tax History
| Year | Tax Paid | Tax Assessment Tax Assessment Total Assessment is a certain percentage of the fair market value that is determined by local assessors to be the total taxable value of land and additions on the property. | Land | Improvement |
|---|---|---|---|---|
| 2025 | $8,223 | $60,790 | $14,410 | $46,380 |
| 2024 | $8,223 | $58,640 | $13,550 | $45,090 |
| 2023 | $8,166 | $64,650 | $14,940 | $49,710 |
| 2022 | $6,629 | $45,410 | $10,770 | $34,640 |
| 2021 | $6,832 | $46,720 | $11,080 | $35,640 |
| 2020 | $6,254 | $42,410 | $10,010 | $32,400 |
| 2019 | $6,257 | $42,710 | $10,080 | $32,630 |
| 2018 | $5,732 | $37,980 | $10,300 | $27,680 |
| 2017 | $5,334 | $41,980 | $11,380 | $30,600 |
| 2016 | $5,579 | $38,940 | $8,760 | $30,180 |
| 2015 | $5,578 | $39,090 | $9,950 | $29,140 |
| 2014 | $5,796 | $39,090 | $9,950 | $29,140 |
Source: Public Records
Map
Nearby Homes
- 4795 Raven Run
- 5033 Silver Feather Way
- 4877 Raven Run
- 4892 Raven Run
- 4475 Eagle River Run
- 3870 W 149th Ave
- 3881 W 149th Ave
- 14534 Fenton St
- 14464 Fenton St
- 4505 Lexi Cir
- 14311 Cottage Way
- 5151 Spyglass Dr
- 14246 Pikeminnow Place Unit 14246
- 14245 Craftsman Way Unit 14245
- 4945 Prebles Place Unit 4945
- 14246 Piney River Rd
- 14278 Currant St
- 3439 W 154th Ave
- 3434 W 154th Place
- 14831 Irving St
- 5007 Buffalo Grass Loop
- 15028 Bottlebrush Run
- 15038 Bottlebrush Run
- 5108 Bottlebrush Run
- 5128 Bottlebrush Run
- 15048 Bottlebrush Run
- 5056 Buffalo Grass Loop
- 15003 Cosmos Way
- 5138 Bottlebrush Run
- 15013 Cosmos Way
- 15039 Bottlebrush Run
- 15023 Cosmos Way
- 15029 Bottlebrush Run
- 15058 Bottlebrush Run
- 15033 Cosmos Way
- 5006 Buffalo Grass Loop
- 15049 Bottlebrush Run
- 15059 Bottlebrush Run
- 4947 Buffalo Grass Loop
- 4976 Buffalo Grass Loop