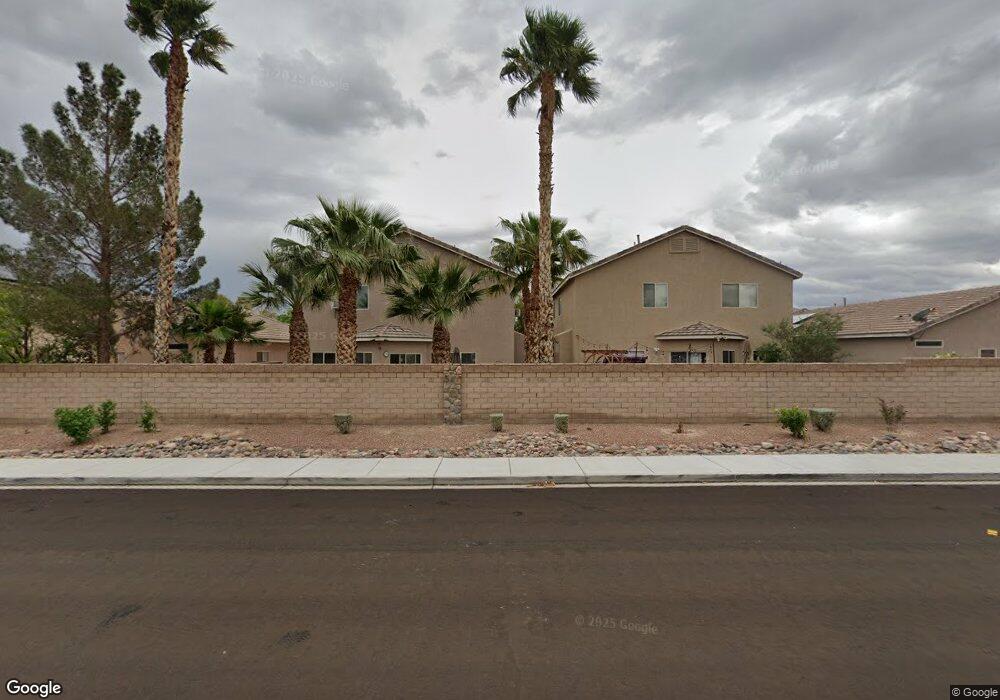
5017 Cascade Pools Ave Las Vegas, NV 89131
Tule Springs NeighborhoodEstimated Value: $410,000 - $433,000
4
Beds
2
Baths
1,805
Sq Ft
$234/Sq Ft
Est. Value
About This Home
This home is located at 5017 Cascade Pools Ave, Las Vegas, NV 89131 and is currently estimated at $422,134, approximately $233 per square foot. 5017 Cascade Pools Ave is a home located in Clark County with nearby schools including Howard E Heckethorn Elementary School, Anthony Saville Middle School, and Shadow Ridge High School.
Ownership History
Date
Name
Owned For
Owner Type
Purchase Details
Closed on
Sep 19, 2005
Sold by
Zarate Miguel A
Bought by
Zarate Julie K
Current Estimated Value
Home Financials for this Owner
Home Financials are based on the most recent Mortgage that was taken out on this home.
Original Mortgage
$185,000
Outstanding Balance
$102,186
Interest Rate
6.37%
Mortgage Type
Unknown
Estimated Equity
$319,948
Purchase Details
Closed on
Feb 27, 2003
Sold by
Zarate Miguel A
Bought by
Zarate Julie K
Home Financials for this Owner
Home Financials are based on the most recent Mortgage that was taken out on this home.
Original Mortgage
$154,897
Interest Rate
5.93%
Purchase Details
Closed on
Mar 19, 2001
Sold by
Beazer Homes Holdings Corp
Bought by
J & J Realty Holdings Llc
Create a Home Valuation Report for This Property
The Home Valuation Report is an in-depth analysis detailing your home's value as well as a comparison with similar homes in the area
Home Values in the Area
Average Home Value in this Area
Purchase History
| Date | Buyer | Sale Price | Title Company |
|---|---|---|---|
| Zarate Julie K | -- | Lawyers Title Of Nevada | |
| Zarate Julie K | -- | Pioneer National Title | |
| Zarate Julie K | $154,897 | Pioneer National Title | |
| J & J Realty Holdings Llc | $152,585 | Lawyers Title |
Source: Public Records
Mortgage History
| Date | Status | Borrower | Loan Amount |
|---|---|---|---|
| Open | Zarate Julie K | $185,000 | |
| Closed | Zarate Julie K | $154,897 |
Source: Public Records
Tax History Compared to Growth
Tax History
| Year | Tax Paid | Tax Assessment Tax Assessment Total Assessment is a certain percentage of the fair market value that is determined by local assessors to be the total taxable value of land and additions on the property. | Land | Improvement |
|---|---|---|---|---|
| 2025 | $1,670 | $100,426 | $29,400 | $71,026 |
| 2024 | $1,622 | $100,426 | $29,400 | $71,026 |
| 2023 | $1,622 | $99,278 | $32,200 | $67,078 |
| 2022 | $1,575 | $88,244 | $26,950 | $61,294 |
| 2021 | $1,529 | $82,157 | $23,800 | $58,357 |
| 2020 | $1,481 | $80,329 | $22,400 | $57,929 |
| 2019 | $1,463 | $77,370 | $20,300 | $57,070 |
| 2018 | $1,396 | $70,848 | $16,100 | $54,748 |
| 2017 | $2,287 | $69,774 | $14,350 | $55,424 |
| 2016 | $1,308 | $59,730 | $10,413 | $49,317 |
| 2015 | $1,305 | $49,590 | $8,033 | $41,557 |
| 2014 | $1,266 | $41,897 | $8,925 | $32,972 |
Source: Public Records
Map
Nearby Homes
- 5004 Cascade Pools Ave
- 5001 Morning Falls Ave
- 5047 Naff Ridge Dr
- 5009 Royal Lake Ave
- 4905 Morning Falls Ave
- 4832 Whispering Spring Ave
- 7633 Rainbow Cove Dr
- 7628 Catalina Harbor St
- 5033 Wild Buffalo Ave
- 7620 Catalina Harbor St
- 7342 N Decatur Blvd Unit 5
- 7825 Celestial Sky St Unit 2
- 7825 Celestial Sky St Unit 812
- 4821 Whisper Lake Ave
- 5001 Pounding Surf Ave
- 7830 Celestial Sky St Unit 762
- 7830 Celestial Sky St Unit 763
- 1349 Plan at Juno Pointe
- 1171 Plan at Juno Pointe
- 1600 Plan at Juno Pointe
- 5013 Cascade Pools Ave
- 5021 Cascade Pools Ave
- 5009 Cascade Pools Ave
- 5025 Cascade Pools Ave
- 5016 Morning Falls Ave
- 5016 Morning Falls Ave Unit na
- 5020 Morning Falls Ave
- 5012 Morning Falls Ave Unit 9B
- 5005 Cascade Pools Ave Unit 9B
- 5029 Cascade Pools Ave
- 5024 Morning Falls Ave
- 5008 Morning Falls Ave Unit 9B
- 5016 Cascade Pools Ave
- 5020 Cascade Pools Ave
- 5012 Cascade Pools Ave
- 5024 Cascade Pools Ave
- 5028 Morning Falls Ave
- 5004 Morning Falls Ave
- 5008 Cascade Pools Ave Unit 9B
- 5001 Cascade Pools Ave