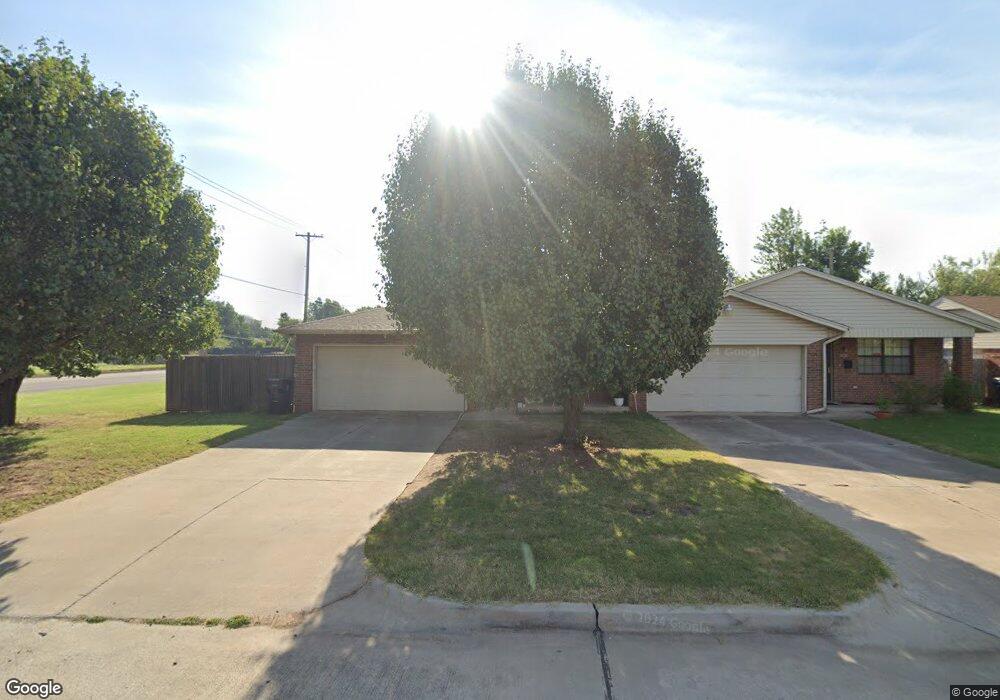
5018 N Utah Ave Oklahoma City, OK 73112
Arbor Grove NeighborhoodEstimated Value: $191,000 - $212,000
3
Beds
2
Baths
1,326
Sq Ft
$151/Sq Ft
Est. Value
About This Home
This home is located at 5018 N Utah Ave, Oklahoma City, OK 73112 and is currently estimated at $200,440, approximately $151 per square foot. 5018 N Utah Ave is a home located in Oklahoma County with nearby schools including Arbor Grove Elementary School, James L. Capps Middle School, and Putnam City High School.
Ownership History
Date
Name
Owned For
Owner Type
Purchase Details
Closed on
Jan 21, 2011
Sold by
Taylor Kellie D and Taylor Kellie
Bought by
Taylor Bradley E and Taylor Brad E
Current Estimated Value
Home Financials for this Owner
Home Financials are based on the most recent Mortgage that was taken out on this home.
Original Mortgage
$61,000
Outstanding Balance
$41,148
Interest Rate
4.56%
Mortgage Type
New Conventional
Estimated Equity
$159,292
Purchase Details
Closed on
Apr 5, 2002
Sold by
Hall Gregory and Hall Becky D
Bought by
Taylor Brad E and Taylor Kellie D
Purchase Details
Closed on
Mar 14, 2002
Sold by
Hall Gregory and Hall Becky D
Bought by
Afzoud Narges
Purchase Details
Closed on
Apr 30, 2001
Sold by
Southern Jerry B and Southern Dorothy G
Bought by
Hall Gregory
Create a Home Valuation Report for This Property
The Home Valuation Report is an in-depth analysis detailing your home's value as well as a comparison with similar homes in the area
Home Values in the Area
Average Home Value in this Area
Purchase History
| Date | Buyer | Sale Price | Title Company |
|---|---|---|---|
| Taylor Bradley E | -- | Capitol Abstract & Title Co | |
| Taylor Brad E | $84,000 | Stewart Abstract & Title | |
| Afzoud Narges | $83,500 | Stewart Abstract & Title | |
| Hall Gregory | $18,000 | Stewart Abstract & Title |
Source: Public Records
Mortgage History
| Date | Status | Borrower | Loan Amount |
|---|---|---|---|
| Open | Taylor Bradley E | $61,000 |
Source: Public Records
Tax History Compared to Growth
Tax History
| Year | Tax Paid | Tax Assessment Tax Assessment Total Assessment is a certain percentage of the fair market value that is determined by local assessors to be the total taxable value of land and additions on the property. | Land | Improvement |
|---|---|---|---|---|
| 2024 | $1,848 | $15,916 | $2,080 | $13,836 |
| 2023 | $1,848 | $15,158 | $1,396 | $13,762 |
| 2022 | $1,782 | $14,437 | $1,463 | $12,974 |
| 2021 | $1,681 | $13,750 | $1,772 | $11,978 |
| 2020 | $1,680 | $13,805 | $1,772 | $12,033 |
| 2019 | $1,655 | $13,805 | $1,724 | $12,081 |
| 2018 | $1,614 | $13,445 | $0 | $0 |
| 2017 | $1,540 | $12,804 | $1,612 | $11,192 |
| 2016 | $1,464 | $12,193 | $1,415 | $10,778 |
| 2015 | $1,410 | $11,613 | $1,140 | $10,473 |
| 2014 | $1,292 | $11,060 | $1,787 | $9,273 |
Source: Public Records
Map
Nearby Homes
- 4129 NW 51st St
- 4105 NW 50th St
- 4324 NW 47th St
- 4212 NW 45th St
- 4406 NW 54th St
- 4317 NW 45th St
- 4333 NW 55th St
- 4124 NW 56th St
- 4325 NW 44th St
- 4208 NW 43rd St
- 4329 NW 44th St
- 4312 NW 56th Terrace
- 5521 N Shawnee Ave
- 4117 NW 56th Place
- 5209 N Roff Ave
- 3901 NW 44th St
- 4129 NW 57th St
- 3820 NW 51st Place
- 4600 NW 46th St
- 5714 N Meridian Ave
- 5012 N Utah Ave
- 4214 NW 50th St
- 4212 NW 50th St
- 5008 N Utah Ave
- 5017 N Utah Ave
- 5017 N Utah Ave Unit 4052276691
- 5015 N Vermont Ave
- 4208 NW 50th St
- 5013 N Utah Ave
- 5009 N Vermont Ave
- 5009 N Utah Ave
- 5004 N Utah Ave
- 4201 NW 50th St
- 5016 N Warren Ave
- 5005 N Utah Ave
- 5012 N Warren Ave
- 5005 N Vermont Ave
- 4204 NW 50th St
- 5012 N Vermont Ave
- 5008 N Vermont Ave