
Seller's Agent in 2021
Scottie Starling
Next Move Real Estate LLC
(678) 646-9545
1 in this area
83 Total Sales
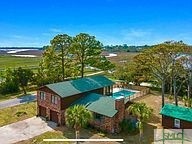

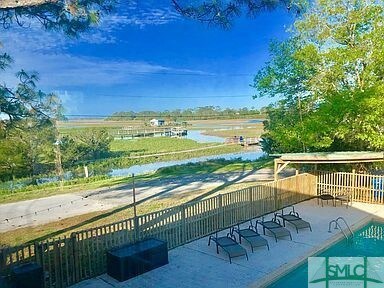

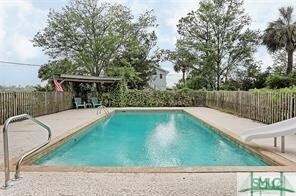
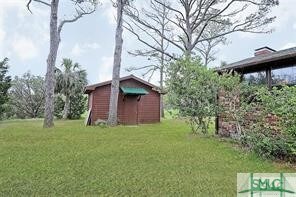
Looking for a view? This is the one. 4 Bed 3 Bath home situated on 5 lots. Sit in your upstairs sunroom and take in the beautiful views of Horse Pen Creek and the marsh. Or, walk or bike only three short blocks to the beach. Home comes with a 16 x 32 Pool, storage shed, and tons of parking for your family and friends. Reclaimed hardwood from historic Marist Day School greets you as you walk in the foyer. Large living room with fireplace, large kitchen with eating area, and a ground level den are found on the bottom floor. Upstairs is complete with 4 bedrooms and 2 baths that have been recently renovated and are like new. Walk out of your master directly onto the above mentioned sunroom. If your an investor looking for a Rental, come take advantage of this location, which may provide potential to add another unit on site. Come see it today. Great home in great location.
Last Agent to Sell the Property
Next Move Real Estate LLC License #313483 Listed on: 07/21/2021
| Date | Type | Sale Price | Title Company |
|---|---|---|---|
| Quit Claim Deed | -- | -- | |
| Warranty Deed | $780,000 | -- | |
| Warranty Deed | -- | -- | |
| Warranty Deed | -- | -- | |
| Warranty Deed | -- | -- | |
| Warranty Deed | $505,000 | -- | |
| Deed | -- | -- | |
| Warranty Deed | -- | -- | |
| Deed | -- | -- | |
| Warranty Deed | -- | -- |
| Date | Status | Loan Amount | Loan Type |
|---|---|---|---|
| Previous Owner | $444,000 | New Conventional | |
| Previous Owner | $508,236 | No Value Available |
| Date | Event | Price | Change | Sq Ft Price |
|---|---|---|---|---|
| 08/20/2021 08/20/21 | Sold | $780,000 | +10.0% | $410 / Sq Ft |
| 07/22/2021 07/22/21 | Pending | -- | -- | -- |
| 07/21/2021 07/21/21 | For Sale | $709,000 | +40.4% | $373 / Sq Ft |
| 12/14/2018 12/14/18 | Sold | $505,000 | -6.5% | $266 / Sq Ft |
| 11/12/2018 11/12/18 | Price Changed | $539,900 | -6.1% | $284 / Sq Ft |
| 10/01/2018 10/01/18 | Price Changed | $574,900 | -4.2% | $302 / Sq Ft |
| 09/07/2018 09/07/18 | Price Changed | $599,900 | -4.0% | $315 / Sq Ft |
| 08/16/2018 08/16/18 | Price Changed | $624,900 | -3.8% | $329 / Sq Ft |
| 06/20/2018 06/20/18 | Price Changed | $649,900 | -7.0% | $342 / Sq Ft |
| 05/15/2018 05/15/18 | For Sale | $699,000 | -- | $368 / Sq Ft |
| Year | Tax Paid | Tax Assessment Tax Assessment Total Assessment is a certain percentage of the fair market value that is determined by local assessors to be the total taxable value of land and additions on the property. | Land | Improvement |
|---|---|---|---|---|
| 2025 | $18,884 | $356,240 | $143,520 | $212,720 |
| 2024 | $18,884 | $299,360 | $143,520 | $155,840 |
| 2023 | $14,832 | $324,960 | $143,520 | $181,440 |
| 2022 | $1,556 | $282,640 | $143,520 | $139,120 |
| 2021 | $1,524 | $179,200 | $79,440 | $99,760 |
| 2020 | $4,634 | $178,160 | $79,440 | $98,720 |
| 2019 | $4,634 | $149,960 | $79,440 | $70,520 |
| 2018 | $679 | $148,200 | $79,440 | $68,760 |
| 2017 | $679 | $140,720 | $79,440 | $61,280 |
| 2016 | $679 | $125,960 | $79,440 | $46,520 |
| 2015 | $685 | $128,240 | $80,360 | $47,880 |
| 2014 | $1,052 | $132,880 | $0 | $0 |
Seller's Agent in 2021
Scottie Starling
Next Move Real Estate LLC
(678) 646-9545
1 in this area
83 Total Sales
Buyer's Agent in 2021
Jennifer Portano
Keller Williams Coastal Area P
(912) 667-5457
32 in this area
48 Total Sales
Seller's Agent in 2018
Maureen O'Connor Simmons
RE/MAX
(912) 272-6808
2 in this area
97 Total Sales
Source: Savannah Multi-List Corporation
MLS Number: 253958
APN: 4001501003
Disclaimer: Certain information contained herein is derived from information provided by parties other than Homes.com. All information provided is deemed reliable, but is not guaranteed to be accurate and should be independently verified.
![]() IDX information is provided exclusively for personal, non-commercial use, and may not be used for any purpose other than to identify prospective properties consumers may be interested in purchasing.
IDX information is provided exclusively for personal, non-commercial use, and may not be used for any purpose other than to identify prospective properties consumers may be interested in purchasing.
Information is deemed reliable but not guaranteed.