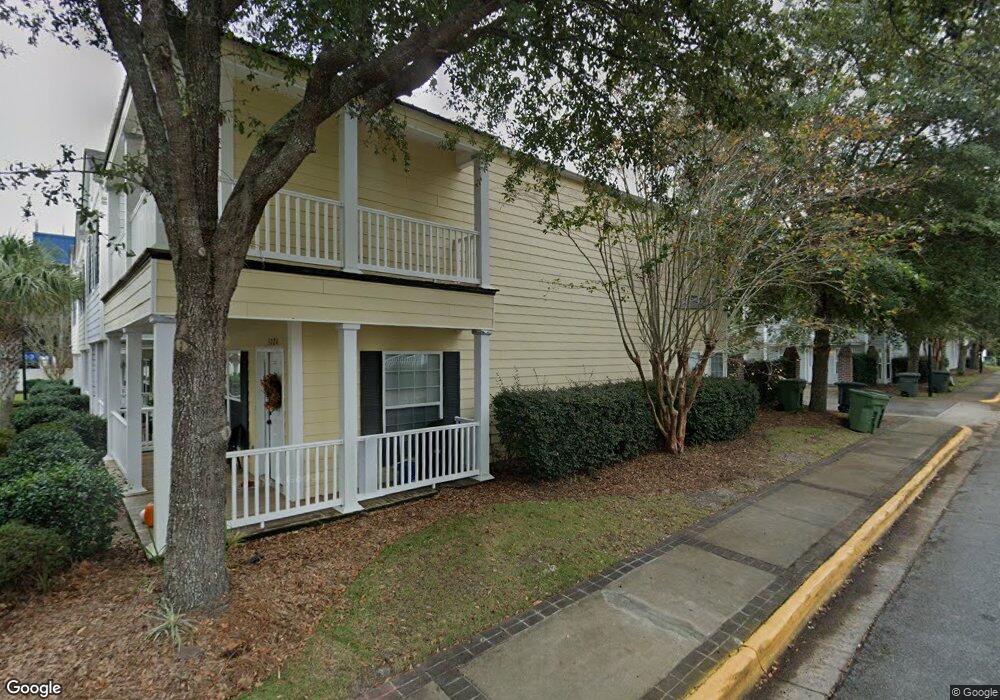
502 Bradwell St Unit 502 Hinesville, GA 31313
Estimated Value: $159,000 - $191,000
3
Beds
3
Baths
1,674
Sq Ft
$108/Sq Ft
Est. Value
About This Home
This home is located at 502 Bradwell St Unit 502, Hinesville, GA 31313 and is currently estimated at $180,082, approximately $107 per square foot. 502 Bradwell St Unit 502 is a home located in Liberty County with nearby schools including Joseph Martin Elementary School, Snelson-Golden Middle School, and Liberty County High School.
Ownership History
Date
Name
Owned For
Owner Type
Purchase Details
Closed on
Oct 18, 2017
Bought by
Moody Norris R
Current Estimated Value
Home Financials for this Owner
Home Financials are based on the most recent Mortgage that was taken out on this home.
Original Mortgage
$73,500
Outstanding Balance
$61,410
Interest Rate
3.83%
Mortgage Type
New Conventional
Estimated Equity
$118,672
Purchase Details
Closed on
May 2, 2017
Sold by
Wilkes Jessie Julian
Bought by
Freedom Mtg Corp
Purchase Details
Closed on
Apr 27, 2007
Sold by
Downtown Grp Llc
Bought by
Wilkes Jessie Julian
Home Financials for this Owner
Home Financials are based on the most recent Mortgage that was taken out on this home.
Original Mortgage
$183,767
Interest Rate
6.11%
Mortgage Type
VA
Purchase Details
Closed on
Sep 19, 2006
Sold by
Downtown Group Llc
Bought by
Colonial Coast Development Co
Create a Home Valuation Report for This Property
The Home Valuation Report is an in-depth analysis detailing your home's value as well as a comparison with similar homes in the area
Home Values in the Area
Average Home Value in this Area
Purchase History
| Date | Buyer | Sale Price | Title Company |
|---|---|---|---|
| Moody Norris R | $98,000 | -- | |
| Freedom Mtg Corp | -- | -- | |
| Sec Of Veterans Affairs | $99,852 | -- | |
| Wilkes Jessie Julian | $179,900 | -- | |
| Colonial Coast Development Co | -- | -- |
Source: Public Records
Mortgage History
| Date | Status | Borrower | Loan Amount |
|---|---|---|---|
| Open | Moody Norris R | $73,500 | |
| Previous Owner | Wilkes Jessie Julian | $183,767 |
Source: Public Records
Tax History Compared to Growth
Tax History
| Year | Tax Paid | Tax Assessment Tax Assessment Total Assessment is a certain percentage of the fair market value that is determined by local assessors to be the total taxable value of land and additions on the property. | Land | Improvement |
|---|---|---|---|---|
| 2024 | $3,466 | $70,537 | $4,400 | $66,137 |
| 2023 | $3,466 | $52,984 | $4,400 | $48,584 |
| 2022 | $2,042 | $43,733 | $4,400 | $39,333 |
| 2021 | $1,888 | $39,672 | $4,400 | $35,272 |
| 2020 | $1,925 | $40,068 | $4,400 | $35,668 |
| 2019 | $1,929 | $40,464 | $4,400 | $36,064 |
| 2018 | $1,859 | $44,333 | $4,400 | $39,933 |
| 2017 | $1,539 | $46,722 | $4,400 | $42,322 |
| 2016 | $2,128 | $47,177 | $4,400 | $42,777 |
| 2015 | $1,962 | $41,031 | $4,400 | $36,631 |
| 2014 | $1,962 | $42,998 | $4,400 | $38,598 |
| 2013 | -- | $44,220 | $4,400 | $39,820 |
Source: Public Records
Map
Nearby Homes
- 205 Wilson Ave
- 0 General Stewart Way
- 411 Woodland Dr
- 0 E General Stewart Way
- 108 W General Stewart Way
- 103 Stewart Terrace
- 24 Sherwood Dr
- 604 Caroline St
- 4 Lots Memorial Dr
- 301 Lakeview Dr
- 996 Stone Ct
- 1 Oglethorpe Ave
- 173 Ironwood Dr
- 215 Collins Ln
- 215 Collins Ln Unit A
- 812 Spanish Oak Dr
- 830 Bradwell St
- 822 Lakeview Ct
- 322 W Memorial West Dr
- 1.76 AC Tranquill Way
- 502 Bradwell St Unit B
- 502 Bradwell St Unit D
- 502 Bradwell St Unit C
- 502 Bradwell St
- 502 Bradwell St Unit 502
- 502 Bradwell St Unit 502
- 502 Bradwell St Unit 502
- 502 Bradwell St Unit A
- 502C Bradwell St
- 502B Bradwell St Unit B
- 502B Bradwell St
- 502A Bradwell St
- 504C Bradwell St
- 500 Bradwell St Unit A
- 500 Bradwell St Unit D
- 500 Bradwell St Unit C
- 500 Bradwell St
- 500 Bradwell St Unit B
- 500 Bradwell St Unit 500
- 500 Bradwell St Unit 500