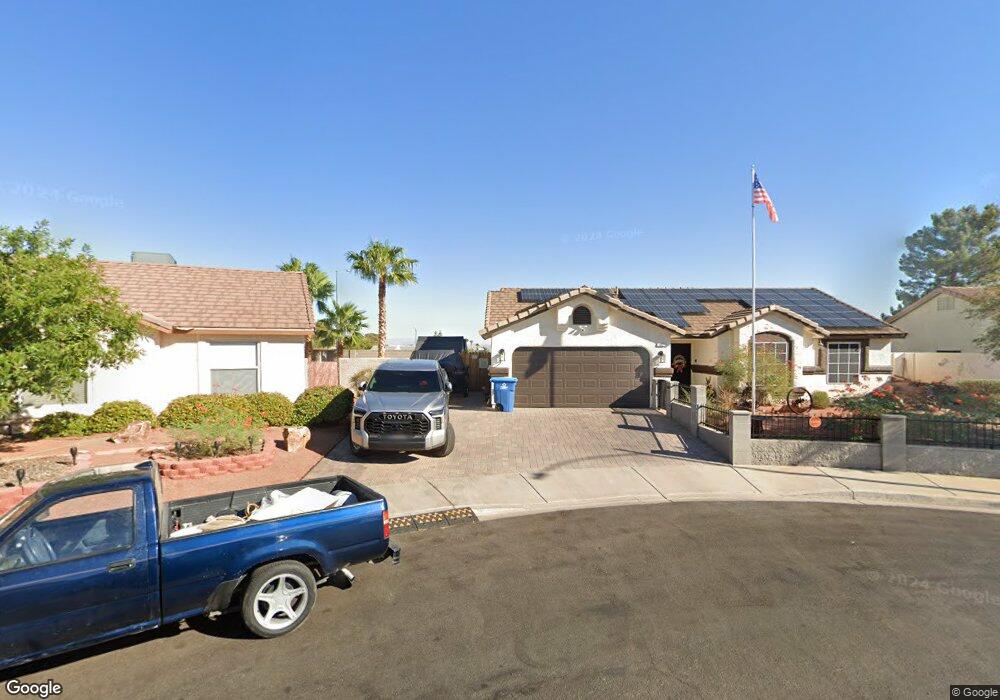
502 Calypso Dr Henderson, NV 89002
Highland Hills NeighborhoodEstimated Value: $405,051 - $437,000
3
Beds
2
Baths
1,380
Sq Ft
$305/Sq Ft
Est. Value
About This Home
This home is located at 502 Calypso Dr, Henderson, NV 89002 and is currently estimated at $421,263, approximately $305 per square foot. 502 Calypso Dr is a home located in Clark County with nearby schools including Fay Galloway Elementary School, Jack & Terry Mannion Middle School, and Foothill High School.
Ownership History
Date
Name
Owned For
Owner Type
Purchase Details
Closed on
Sep 15, 2023
Sold by
Floren David A and Floren Colleen
Bought by
Floren David A and Floren Colleen
Current Estimated Value
Purchase Details
Closed on
Jan 24, 2002
Sold by
Floren David A
Bought by
Floren David A and Floren Colleen
Home Financials for this Owner
Home Financials are based on the most recent Mortgage that was taken out on this home.
Original Mortgage
$116,700
Interest Rate
7.17%
Purchase Details
Closed on
May 16, 1997
Sold by
Yateman David and Yateman Marlene
Bought by
Floren David A
Home Financials for this Owner
Home Financials are based on the most recent Mortgage that was taken out on this home.
Original Mortgage
$118,865
Interest Rate
8.13%
Mortgage Type
FHA
Purchase Details
Closed on
Apr 27, 1994
Sold by
Pitchford James E and Pitchford Judith M
Bought by
Yateman David and Yateman Marlene
Home Financials for this Owner
Home Financials are based on the most recent Mortgage that was taken out on this home.
Original Mortgage
$52,000
Interest Rate
8.52%
Create a Home Valuation Report for This Property
The Home Valuation Report is an in-depth analysis detailing your home's value as well as a comparison with similar homes in the area
Home Values in the Area
Average Home Value in this Area
Purchase History
| Date | Buyer | Sale Price | Title Company |
|---|---|---|---|
| Floren David A | -- | Title Deeds & Needs | |
| Floren David A | -- | Nevada Title Company | |
| Floren David A | $120,000 | Old Republic Title Company | |
| Yateman David | $103,000 | Nevada Title Company |
Source: Public Records
Mortgage History
| Date | Status | Borrower | Loan Amount |
|---|---|---|---|
| Previous Owner | Floren David A | $116,700 | |
| Previous Owner | Floren David A | $118,865 | |
| Previous Owner | Yateman David | $52,000 |
Source: Public Records
Tax History Compared to Growth
Tax History
| Year | Tax Paid | Tax Assessment Tax Assessment Total Assessment is a certain percentage of the fair market value that is determined by local assessors to be the total taxable value of land and additions on the property. | Land | Improvement |
|---|---|---|---|---|
| 2025 | $1,268 | $74,174 | $26,950 | $47,224 |
| 2024 | $1,232 | $74,174 | $26,950 | $47,224 |
| 2023 | $1,232 | $77,018 | $31,850 | $45,168 |
| 2022 | $1,196 | $67,653 | $26,250 | $41,403 |
| 2021 | $1,161 | $63,036 | $23,450 | $39,586 |
| 2020 | $1,124 | $62,893 | $23,450 | $39,443 |
| 2019 | $1,091 | $57,930 | $18,900 | $39,030 |
| 2018 | $1,060 | $54,141 | $16,450 | $37,691 |
| 2017 | $1,577 | $54,418 | $16,100 | $38,318 |
| 2016 | $1,005 | $47,363 | $8,750 | $38,613 |
| 2015 | $1,002 | $41,638 | $8,750 | $32,888 |
| 2014 | $972 | $32,564 | $8,750 | $23,814 |
Source: Public Records
Map
Nearby Homes
- 533 Calypso Dr
- 709 Greenway Rd
- 710 Greenway Rd
- 503 Credence Ave
- 860 Bergamont Dr
- 815 Crabapple Dr
- 322 Wintercress Dr
- 633 Severn St
- 307 Balsa St
- 419 Chateau Dr
- 408 Scenic Dr
- 385 Cove Ct Unit 2
- 848 Coral Cottage Dr
- 805 Lupine Ct
- 467 Mission Dr
- 1040 Wavehugger Dr
- 1045 Wavehugger Dr
- 1030 Wavehugger Dr
- 1035 Wavehugger Dr
- 1020 Wavehugger Dr
- 504 Calypso Dr
- 500 Calypso Dr
- 506 Calypso Dr
- 801 Teal Wing Way
- 803 Teal Wing Way
- 501 Calypso Dr
- 503 Calypso Dr
- 508 Calypso Dr
- 505 Calypso Dr
- 742 Willow Ave
- 746 Willow Ave
- 805 Teal Wing Way
- 507 Calypso Dr
- 740 Willow Ave
- 748 Willow Ave
- 807 Teal Wing Way
- 510 Calypso Dr
- 809 Bravado St
- 738 Willow Ave
- 809 Bravado Dr