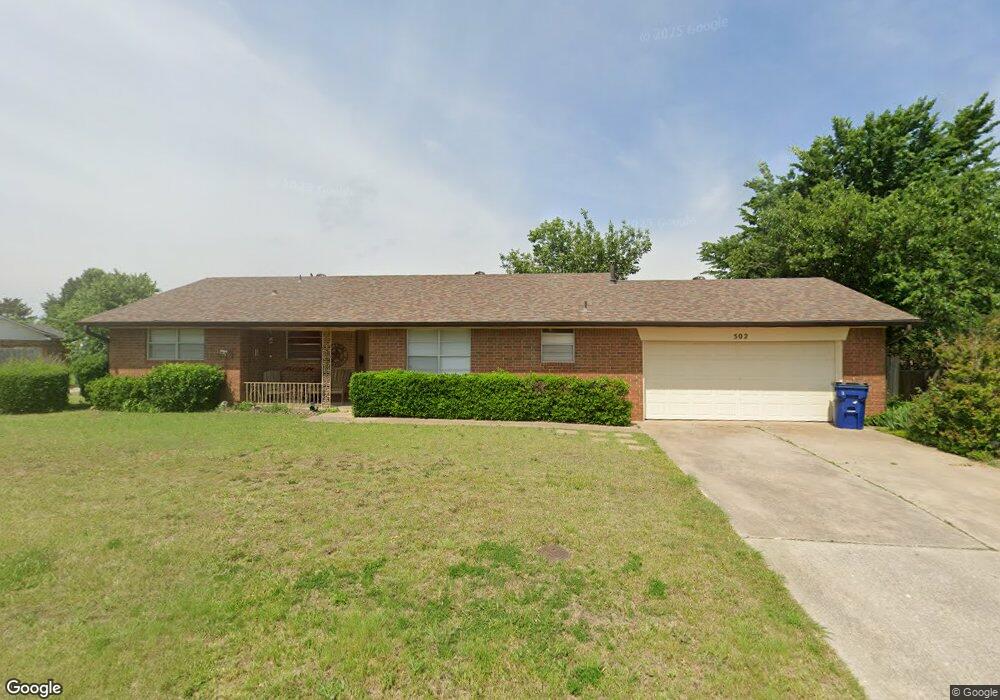
502 Cherokee Ln El Reno, OK 73036
Estimated Value: $147,629 - $182,000
3
Beds
2
Baths
1,412
Sq Ft
$118/Sq Ft
Est. Value
About This Home
This home is located at 502 Cherokee Ln, El Reno, OK 73036 and is currently estimated at $167,157, approximately $118 per square foot. 502 Cherokee Ln is a home located in Canadian County with nearby schools including Hillcrest Elementary School, Lincoln Learning Center, and Rose Witcher Elementary School.
Ownership History
Date
Name
Owned For
Owner Type
Purchase Details
Closed on
Feb 20, 2023
Sold by
Jerry And Sharon Jackson Living Trust
Bought by
Jackson Willis Edgar
Current Estimated Value
Purchase Details
Closed on
Jun 8, 2022
Sold by
Lynn Jackson Jerry and Lynn Ann Sharon
Bought by
Jerry And Sharon Jackson Living Trust
Purchase Details
Closed on
Apr 28, 2016
Sold by
Jackson Jerry Lynn and Jackson Willis Edgar
Bought by
Jackson Jerry Lynn and Jackson Sharon
Purchase Details
Closed on
Jun 22, 2009
Sold by
Avant Fiorella and Avant Kris
Bought by
Cremer Martha L and Cremer Ii Max B
Purchase Details
Closed on
Aug 28, 2008
Sold by
Cremer Max B
Bought by
Cremer Martha L
Purchase Details
Closed on
Sep 17, 2005
Sold by
Cremer Max B and Cremer Martha
Bought by
Avant Fiorella Rebeca Cremer and Cremer Martha
Purchase Details
Closed on
Jan 9, 1992
Sold by
Conversion
Bought by
Jackson Neva R
Create a Home Valuation Report for This Property
The Home Valuation Report is an in-depth analysis detailing your home's value as well as a comparison with similar homes in the area
Home Values in the Area
Average Home Value in this Area
Purchase History
| Date | Buyer | Sale Price | Title Company |
|---|---|---|---|
| Jackson Willis Edgar | -- | -- | |
| Jerry And Sharon Jackson Living Trust | -- | None Listed On Document | |
| Jackson Jerry Lynn | -- | None Available | |
| Cremer Martha L | -- | Agt | |
| Cremer Martha L | -- | None Available | |
| Avant Fiorella Rebeca Cremer | -- | None Available | |
| Jackson Neva R | $47,500 | -- |
Source: Public Records
Tax History Compared to Growth
Tax History
| Year | Tax Paid | Tax Assessment Tax Assessment Total Assessment is a certain percentage of the fair market value that is determined by local assessors to be the total taxable value of land and additions on the property. | Land | Improvement |
|---|---|---|---|---|
| 2024 | $1,059 | $10,701 | $1,337 | $9,364 |
| 2023 | $1,059 | $10,390 | $1,260 | $9,130 |
| 2022 | $1,031 | $10,087 | $1,260 | $8,827 |
| 2021 | $1,024 | $9,793 | $1,260 | $8,533 |
| 2020 | $1,016 | $9,839 | $1,260 | $8,579 |
| 2019 | $1,029 | $9,552 | $1,260 | $8,292 |
| 2018 | $987 | $9,274 | $1,260 | $8,014 |
| 2017 | $1,007 | $9,274 | $1,260 | $8,014 |
| 2016 | $1,055 | $9,309 | $1,260 | $8,049 |
| 2015 | $991 | $8,694 | $1,260 | $7,434 |
| 2014 | $991 | $8,718 | $1,260 | $7,458 |
Source: Public Records
Map
Nearby Homes
- 420 SW 24th St
- 300 Cherokee Ln
- 508 SW 24th St
- 609 Skyline Dr
- 605 Thompson Dr
- 1502 S Reno Ave
- 601 Thompson Dr
- 800 Fairfax Ln
- 1705 S Dille Ave
- 1309 Fairfax Ln
- 818 SW 26th Place
- 2502 Ridgecrest Dr
- 1646 U S Route 66
- 106 Slant St
- 2606 Ridgecrest Dr
- 1127 S Reno Ave
- 1012 S Ellison Ave
- 0 Property Borders I-40 and Choctaw Rd's Unit 1137947
- 602 W Elm St
- 1515 Strawberry Fields
- 412 SW 24th St
- 500 Cherokee Ln
- 316 SW 24th St
- 416 SW 24th St
- 405 SW 24th St
- 2401 S Dille Ave
- 219 SW 23rd St
- 305 SW 23rd St
- 2400 S Jensen Ave
- 312 SW 24th St
- 217 SW 23rd St
- 2405 S Dille Ave
- 2404 S Jensen Ave
- 307 SW 23rd St
- 2400 S Dille Ave
- 309 SW 23rd St
- 308 SW 24th St
- 215 SW 23rd St
- 300 SW 23rd St
- 2404 S Dille Ave