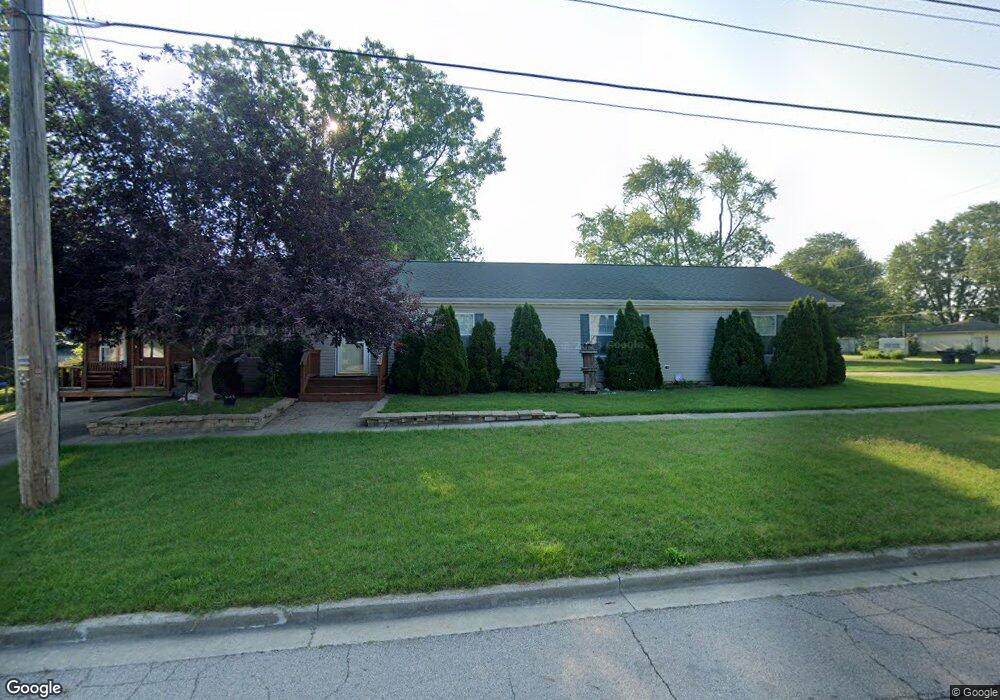
502 Cherry St Three Oaks, MI 49128
Estimated Value: $303,000 - $363,000
Studio
--
Bath
1,404
Sq Ft
$234/Sq Ft
Est. Value
About This Home
This home is located at 502 Cherry St, Three Oaks, MI 49128 and is currently estimated at $328,777, approximately $234 per square foot. 502 Cherry St is a home located in Berrien County with nearby schools including River Valley Middle/High School.
Ownership History
Date
Name
Owned For
Owner Type
Purchase Details
Closed on
Jul 26, 2018
Sold by
Payne Bradford C and Payne Betty J
Bought by
Krause Carl L
Current Estimated Value
Home Financials for this Owner
Home Financials are based on the most recent Mortgage that was taken out on this home.
Original Mortgage
$144,400
Outstanding Balance
$125,406
Interest Rate
4.5%
Mortgage Type
New Conventional
Estimated Equity
$203,371
Purchase Details
Closed on
Mar 17, 2004
Sold by
Hollihan Michael L and Hollihan Linda J
Bought by
Payne Bradford C and Payne Betty J
Purchase Details
Closed on
Oct 6, 1997
Create a Home Valuation Report for This Property
The Home Valuation Report is an in-depth analysis detailing your home's value as well as a comparison with similar homes in the area
Purchase History
| Date | Buyer | Sale Price | Title Company |
|---|---|---|---|
| Krause Carl L | $152,000 | None Listed On Document | |
| Krause Carl L | $152,000 | None Available | |
| Payne Bradford C | $2,500 | -- | |
| -- | $8,000 | -- |
Source: Public Records
Mortgage History
| Date | Status | Borrower | Loan Amount |
|---|---|---|---|
| Open | Krause Carl L | $144,400 | |
| Closed | Krause Carl L | $144,400 |
Source: Public Records
Tax History
| Year | Tax Paid | Tax Assessment Tax Assessment Total Assessment is a certain percentage of the fair market value that is determined by local assessors to be the total taxable value of land and additions on the property. | Land | Improvement |
|---|---|---|---|---|
| 2025 | $1,407 | $150,200 | $0 | $0 |
| 2024 | $1,584 | $137,500 | $0 | $0 |
| 2023 | $1,508 | $140,100 | $0 | $0 |
| 2022 | $1,449 | $99,700 | $0 | $0 |
| 2021 | $2,075 | $90,300 | $11,300 | $79,000 |
| 2020 | $1,944 | $68,700 | $0 | $0 |
| 2019 | $2,833 | $56,900 | $2,900 | $54,000 |
Source: Public Records
Map
Nearby Homes
- 308 N Elm St
- 9 Beech St E
- 207 Cherry St
- 106 Beech St E
- 201 Sycamore St E
- 103 Maple St
- 202 Maple St
- 37 Huckleberry
- 202 S Elm St
- 7079 U S 12
- 7200 U S 12
- 614 Magnolia St
- 616 Magnolia St
- 8400 Kruger Rd
- 7078 Us 12 Hwy W
- 0 W Elm Valley Rd Unit 25049923
- 18216 S Schwark Rd
- 14736 Flynn Rd
- 6340 Warren Woods Rd
- 0 Warren Woods Rd
Your Personal Tour Guide
Ask me questions while you tour the home.