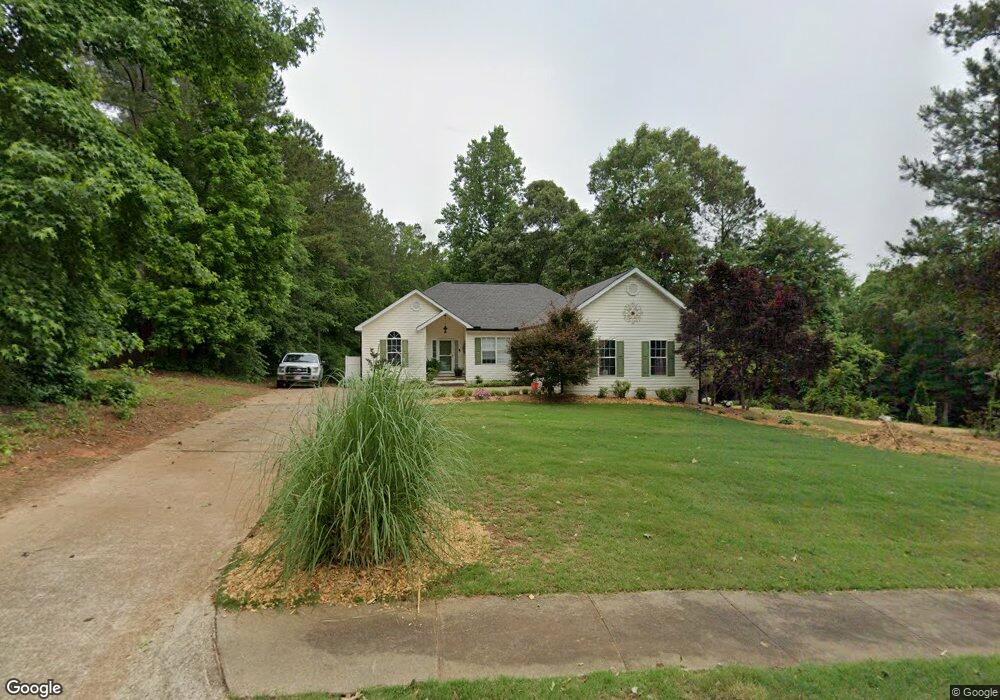
502 Cumberland Trail Senoia, GA 30276
Estimated Value: $329,000 - $442,000
3
Beds
2
Baths
3,112
Sq Ft
$122/Sq Ft
Est. Value
About This Home
This home is located at 502 Cumberland Trail, Senoia, GA 30276 and is currently estimated at $378,159, approximately $121 per square foot. 502 Cumberland Trail is a home located in Coweta County with nearby schools including Eastside Elementary School, East Coweta Middle School, and East Coweta High School.
Ownership History
Date
Name
Owned For
Owner Type
Purchase Details
Closed on
Oct 13, 2010
Sold by
Krekel Patrick M
Bought by
Boyle David J
Current Estimated Value
Home Financials for this Owner
Home Financials are based on the most recent Mortgage that was taken out on this home.
Original Mortgage
$169,412
Outstanding Balance
$111,851
Interest Rate
4.36%
Mortgage Type
VA
Estimated Equity
$266,308
Purchase Details
Closed on
Jan 5, 1998
Sold by
Lichty Bros Const
Bought by
Krekel Patrick M
Home Financials for this Owner
Home Financials are based on the most recent Mortgage that was taken out on this home.
Original Mortgage
$116,100
Interest Rate
7.2%
Mortgage Type
New Conventional
Purchase Details
Closed on
Mar 4, 1997
Bought by
Lichty Bros Construc
Purchase Details
Closed on
Jan 10, 1994
Bought by
Village Development
Create a Home Valuation Report for This Property
The Home Valuation Report is an in-depth analysis detailing your home's value as well as a comparison with similar homes in the area
Home Values in the Area
Average Home Value in this Area
Purchase History
| Date | Buyer | Sale Price | Title Company |
|---|---|---|---|
| Boyle David J | $164,000 | -- | |
| Krekel Patrick M | $119,800 | -- | |
| Lichty Bros Construc | $18,500 | -- | |
| Village Development | $127,000 | -- |
Source: Public Records
Mortgage History
| Date | Status | Borrower | Loan Amount |
|---|---|---|---|
| Open | Boyle David J | $169,412 | |
| Previous Owner | Krekel Patrick M | $116,100 |
Source: Public Records
Tax History Compared to Growth
Tax History
| Year | Tax Paid | Tax Assessment Tax Assessment Total Assessment is a certain percentage of the fair market value that is determined by local assessors to be the total taxable value of land and additions on the property. | Land | Improvement |
|---|---|---|---|---|
| 2024 | $4,095 | $147,293 | $24,000 | $123,293 |
| 2023 | $4,095 | $141,166 | $24,000 | $117,166 |
| 2022 | $3,414 | $116,840 | $24,000 | $92,840 |
| 2021 | $2,728 | $86,117 | $20,000 | $66,117 |
| 2020 | $2,780 | $86,117 | $20,000 | $66,117 |
| 2019 | $2,826 | $79,100 | $9,000 | $70,100 |
| 2018 | $2,841 | $79,100 | $9,000 | $70,100 |
| 2017 | $2,855 | $79,100 | $9,000 | $70,100 |
| 2016 | $2,604 | $72,266 | $9,000 | $63,266 |
| 2015 | $2,241 | $63,152 | $9,000 | $54,152 |
| 2014 | $2,075 | $60,874 | $9,000 | $51,874 |
Source: Public Records
Map
Nearby Homes
- 90 Howard Rd
- 36 Cumberland Trail
- 260 Willow Dell Dr
- 215 Duck Dr
- 150 Duck Dr
- 245 Kenwood Trail
- 275 Kenwood Trail
- 316 Hammerstone Ct Unit 19
- 129 Rutland Ct
- 44 Standing Rock Rd
- 350 Cushing St
- 71 Lower Creek Trail
- 335 Cushing St
- 103 Morgan St
- 130 Putney Way
- 126 Morgan St
- 124 Morgan St
- 70 Mcmillan Way
- 58 Mcmillan Way
- 45 Cushing St Unit 156
- 492 Cumberland Trail Unit 18
- 492 Cumberland Trail
- 510 Cumberland Trail
- 519 Cumberland Trail
- 480 Cumberland Trail
- 489 Cumberland Trail
- 512 Cumberland Trail
- 475 Cumberland Trail
- 448 Cumberland Trail
- 453 Cumberland Trail
- 441 Cumberland Trail
- 441 Cumberland Trail Unit 27
- 229 Covington Cove
- 0 Howard Rd Unit 2 20116121
- 0 Howard Rd Unit 1 20116109
- 0 Howard Rd Unit 3274466
- 0 Howard Rd Unit 8657613
- 0 Howard Rd Unit 7555295
- 0 Howard Rd Unit 7118905
- 0 Howard Rd Unit 7147883