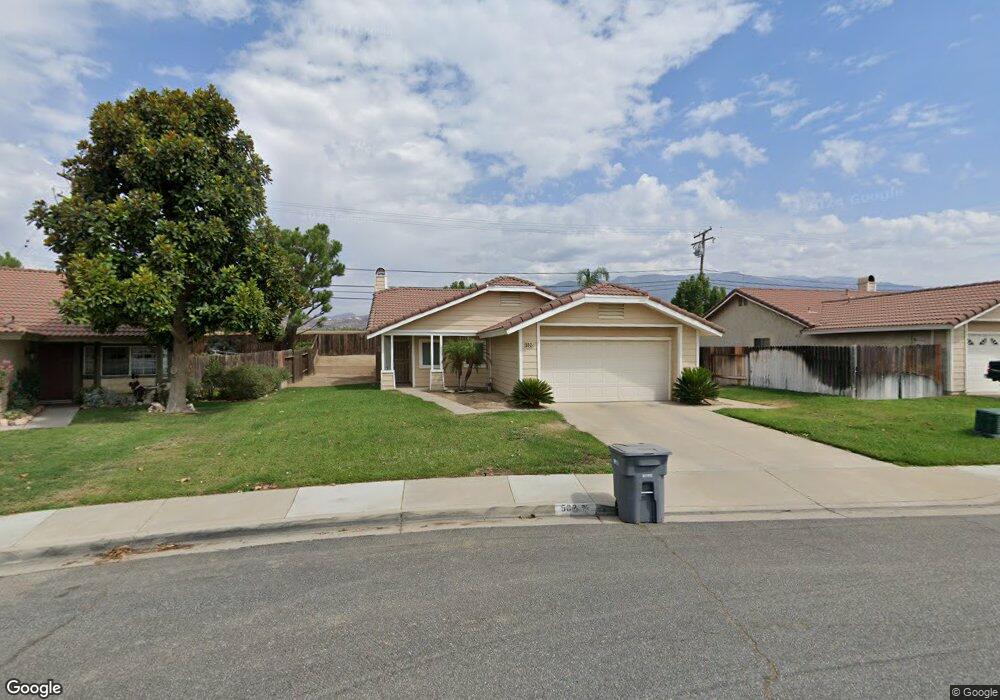
502 Cynthia St Beaumont, CA 92223
Beaumont AreaEstimated Value: $416,000 - $457,000
About This Home
This home is located at 502 Cynthia St, Beaumont, CA 92223 and is currently estimated at $433,810, approximately $432 per square foot. 502 Cynthia St is a home located in Riverside County with nearby schools including Starlight Elementary School, San Gorgonio Middle School, and Beaumont Senior High School.
Ownership History
We collect this data history from publicly available records. To have your information removed, we recommend requesting removal directly through your county’s website.
Purchase Details
Home Financials for this Owner
Home Financials are based on the most recent Mortgage that was taken out on this home.Purchase Details
Home Values in the Area
Average Home Value in this Area
Purchase History
We collect this data history from publicly available records. To have your information removed, we recommend requesting removal directly through your county’s website.
| Date | Buyer | Sale Price | Title Company |
|---|---|---|---|
| $203,000 | New Century Title Company | ||
| -- | -- |
Mortgage History
We collect this data history from publicly available records. To have your information removed, we recommend requesting removal directly through your county’s website.
| Date | Status | Borrower | Loan Amount |
|---|---|---|---|
| Open | $182,700 |
Tax History
We collect this data history from publicly available records. To have your information removed, we recommend requesting removal directly through your county’s website.
| Year | Tax Paid | Tax Assessment Tax Assessment Total Assessment is a certain percentage of the fair market value that is determined by local assessors to be the total taxable value of land and additions on the property. | Land | Improvement |
|---|---|---|---|---|
| 2025 | $3,999 | $282,940 | $83,622 | $199,318 |
| 2023 | $3,999 | $271,955 | $80,376 | $191,579 |
| 2022 | $3,554 | $266,623 | $78,800 | $187,823 |
| 2021 | $3,444 | $261,396 | $77,255 | $184,141 |
| 2020 | $3,407 | $258,716 | $76,463 | $182,253 |
| 2019 | $3,352 | $253,644 | $74,964 | $178,680 |
| 2018 | $3,338 | $248,672 | $73,495 | $175,177 |
| 2017 | $3,284 | $243,797 | $72,054 | $171,743 |
| 2016 | $2,816 | $211,000 | $62,000 | $149,000 |
| 2015 | $2,230 | $168,000 | $50,000 | $118,000 |
| 2014 | $2,026 | $150,000 | $44,000 | $106,000 |
Map
- 1771 Vasili Ln
- 511 Lois Ln
- 1679 Stone Creek Rd
- 1665 Ravenswood Rd
- 39894 Brookside Ave
- 1526 Trinette Dr
- 10410 Live Oak Ave
- 1340 Alpine Ave
- 10269 Live Oak Ave
- 11615 Zoeller St
- 1388 Melstone St
- 1628 Tildon Ct
- 39068 Vineland St
- 10123 Live Oak Ave
- 1425 Cherry Ave Unit 202
- 1425 Cherry Ave Unit 135
- 1425 Cherry Ave Unit 145
- 1425 Cherry Ave Unit 172
- 1709 Double Eagle Ave
- 738 Flower St
Ask me questions while you tour the home.