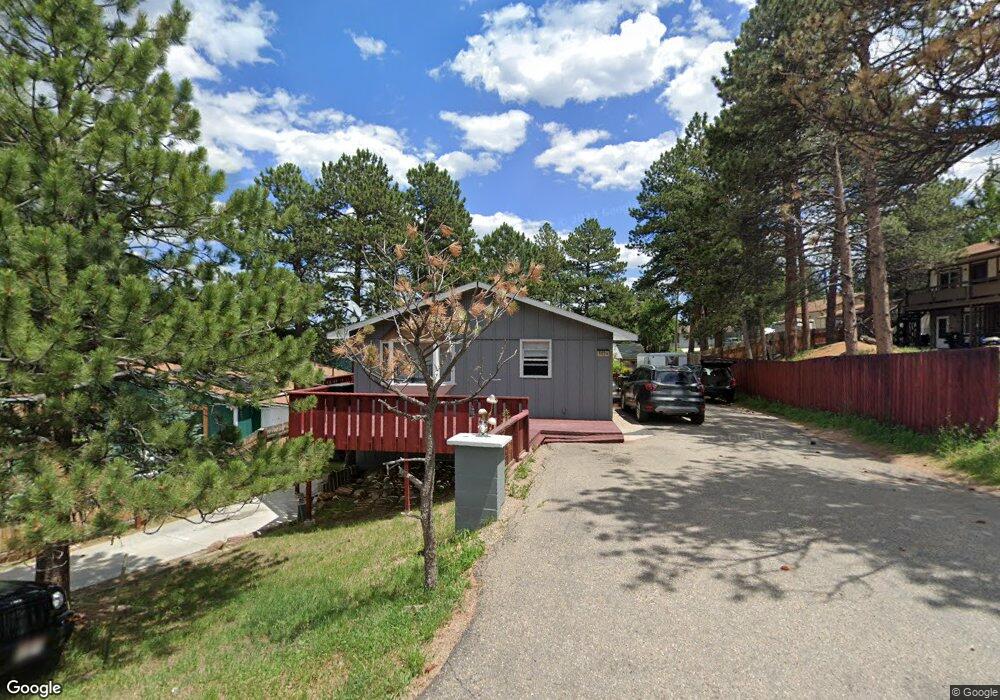
502 Driftwood Ave Estes Park, CO 80517
Estimated Value: $509,000 - $648,000
5
Beds
3
Baths
2,180
Sq Ft
$257/Sq Ft
Est. Value
About This Home
This home is located at 502 Driftwood Ave, Estes Park, CO 80517 and is currently estimated at $559,482, approximately $256 per square foot. 502 Driftwood Ave is a home located in Larimer County with nearby schools including Estes Park K-5 School, Estes Park Options School, and Estes Park Middle School.
Ownership History
Date
Name
Owned For
Owner Type
Purchase Details
Closed on
Mar 29, 2007
Sold by
Splane Donna M Pollak
Bought by
Baxter Joshua and Baxter Maria
Current Estimated Value
Home Financials for this Owner
Home Financials are based on the most recent Mortgage that was taken out on this home.
Original Mortgage
$250,000
Outstanding Balance
$151,903
Interest Rate
6.24%
Mortgage Type
Purchase Money Mortgage
Estimated Equity
$407,579
Purchase Details
Closed on
Aug 18, 2000
Sold by
Kearney John M Laura J
Bought by
Splane Donna M Pollak
Purchase Details
Closed on
Jun 5, 1997
Sold by
Kearney John M
Bought by
Kearney John M and Kearney Laura J
Purchase Details
Closed on
Oct 1, 1994
Sold by
Reeder Linda Sue
Bought by
Kearney Laura J
Purchase Details
Closed on
Jun 1, 1993
Sold by
Patrick Marianne U
Bought by
Reeder Linda
Create a Home Valuation Report for This Property
The Home Valuation Report is an in-depth analysis detailing your home's value as well as a comparison with similar homes in the area
Home Values in the Area
Average Home Value in this Area
Purchase History
| Date | Buyer | Sale Price | Title Company |
|---|---|---|---|
| Baxter Joshua | $250,000 | Commonwealth Title | |
| Splane Donna M Pollak | $200,000 | -- | |
| Kearney John M | -- | -- | |
| Kearney Laura J | $115,500 | -- | |
| Reeder Linda | $84,500 | -- |
Source: Public Records
Mortgage History
| Date | Status | Borrower | Loan Amount |
|---|---|---|---|
| Open | Baxter Joshua | $250,000 |
Source: Public Records
Tax History Compared to Growth
Tax History
| Year | Tax Paid | Tax Assessment Tax Assessment Total Assessment is a certain percentage of the fair market value that is determined by local assessors to be the total taxable value of land and additions on the property. | Land | Improvement |
|---|---|---|---|---|
| 2025 | $2,159 | $33,165 | $13,400 | $19,765 |
| 2024 | $2,122 | $33,165 | $13,400 | $19,765 |
| 2022 | $1,975 | $25,860 | $5,848 | $20,012 |
| 2021 | $2,072 | $27,191 | $6,149 | $21,042 |
| 2020 | $1,749 | $22,658 | $6,149 | $16,509 |
| 2019 | $1,739 | $22,658 | $6,149 | $16,509 |
| 2018 | $1,348 | $17,035 | $5,544 | $11,491 |
| 2017 | $1,356 | $17,035 | $5,544 | $11,491 |
| 2016 | $1,324 | $17,632 | $5,652 | $11,980 |
| 2015 | $1,338 | $17,630 | $5,650 | $11,980 |
| 2014 | $1,338 | $18,090 | $5,090 | $13,000 |
Source: Public Records
Map
Nearby Homes
- 500 Elm Ave
- 435 Columbine Ave
- 517 Birch Ave
- 404 Elm Ave
- 603 Aspen Ave Unit B4
- 603 Aspen Ave Unit C1
- 407 Stanley Ave
- 435 Moccasin Circle Dr
- 830 Morgan St
- 654 Morgan St
- 659 Morgan St
- 261 South Ct
- 219 3rd St
- TBD Stanley Ave
- Lot 744 St Vrain Dr Unit 4723401238
- Lot 744 St Vrain Dr
- 850 Shady Ln
- 910 Shady Ln
- 704 Birdie Ln Unit 17
- 734 Birdie Ln Unit 15
- 460 Driftwood Ave
- 514 Driftwood Ave
- 507 Columbine Ave
- 503 Columbine Ave
- 452 Driftwood Ave
- 503 Driftwood Ave
- 505 Driftwood Ave
- 516 Driftwood Ave
- 501 Columbine Ave
- 513 Columbine Ave
- 507 Driftwood Ave
- 522 Driftwood Ave
- 442 Driftwood Ave
- 441 Columbine Ave
- 519 Columbine Ave
- 515 Driftwood Ave Unit 4
- 515 Driftwood Ave Unit 3
- 515 Driftwood Ave Unit 2
- 515 Driftwood Ave Unit 1
- 530 Driftwood Ave