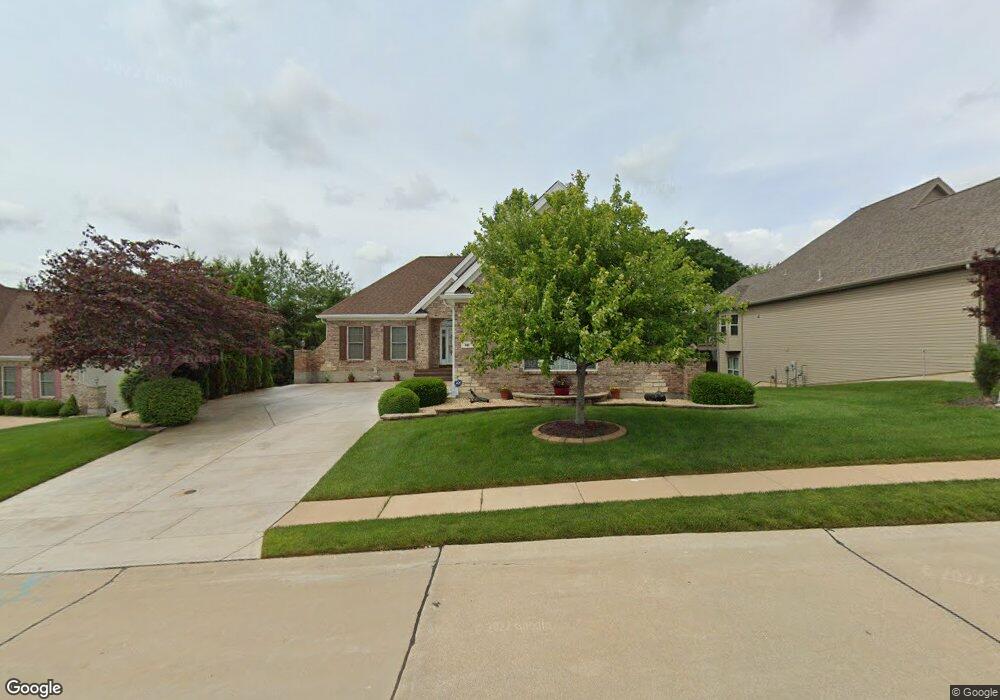
502 Dunmore Place Ct Saint Charles, MO 63304
Estimated Value: $469,000 - $522,353
2
Beds
3
Baths
1,894
Sq Ft
$267/Sq Ft
Est. Value
About This Home
This home is located at 502 Dunmore Place Ct, Saint Charles, MO 63304 and is currently estimated at $505,588, approximately $266 per square foot. 502 Dunmore Place Ct is a home located in St. Charles County with nearby schools including Warren Elementary School, Francis Howell Middle School, and Francis Howell Central High School.
Ownership History
Date
Name
Owned For
Owner Type
Purchase Details
Closed on
Jan 6, 2011
Sold by
The Jerry D Shaw & Mary A Shaw Revocable
Bought by
Shaw Jerry D and Shaw Mary A
Current Estimated Value
Home Financials for this Owner
Home Financials are based on the most recent Mortgage that was taken out on this home.
Original Mortgage
$229,500
Outstanding Balance
$154,811
Interest Rate
4.56%
Mortgage Type
New Conventional
Estimated Equity
$350,777
Purchase Details
Closed on
May 25, 2006
Sold by
Shaw Jerry D and Shaw Mary A
Bought by
The Jerry D & Mary A Shaw Revocable Tr
Purchase Details
Closed on
Jul 15, 2005
Sold by
Nel Co Development Inc
Bought by
Shaw Jerry D and Shaw Mary A
Home Financials for this Owner
Home Financials are based on the most recent Mortgage that was taken out on this home.
Original Mortgage
$250,000
Interest Rate
5.64%
Mortgage Type
Fannie Mae Freddie Mac
Create a Home Valuation Report for This Property
The Home Valuation Report is an in-depth analysis detailing your home's value as well as a comparison with similar homes in the area
Home Values in the Area
Average Home Value in this Area
Purchase History
| Date | Buyer | Sale Price | Title Company |
|---|---|---|---|
| Shaw Jerry D | -- | American Land Title | |
| The Jerry D & Mary A Shaw Revocable Tr | -- | None Available | |
| Shaw Jerry D | -- | Ust |
Source: Public Records
Mortgage History
| Date | Status | Borrower | Loan Amount |
|---|---|---|---|
| Open | Shaw Jerry D | $229,500 | |
| Closed | Shaw Jerry D | $250,000 |
Source: Public Records
Tax History Compared to Growth
Tax History
| Year | Tax Paid | Tax Assessment Tax Assessment Total Assessment is a certain percentage of the fair market value that is determined by local assessors to be the total taxable value of land and additions on the property. | Land | Improvement |
|---|---|---|---|---|
| 2025 | $4,988 | $90,750 | -- | -- |
| 2023 | $4,985 | $80,317 | $0 | $0 |
| 2022 | $4,844 | $72,431 | $0 | $0 |
| 2021 | $4,848 | $72,431 | $0 | $0 |
| 2020 | $4,643 | $67,123 | $0 | $0 |
| 2019 | $4,623 | $67,123 | $0 | $0 |
| 2018 | $4,519 | $62,650 | $0 | $0 |
| 2017 | $4,483 | $62,650 | $0 | $0 |
| 2016 | $3,965 | $53,260 | $0 | $0 |
| 2015 | $3,931 | $53,260 | $0 | $0 |
| 2014 | $3,816 | $50,123 | $0 | $0 |
Source: Public Records
Map
Nearby Homes
- 25 Terre Verte Ct
- 301 Switchgrass Landing Ln
- 0 Universal Design Prairie Bluff Unit MAR24041208
- Rosemont Plan at Prairie Bluff - Heritage Collection
- Sierra Plan at Prairie Bluff - Heritage Collection
- Sierra – Universal Design Plan at Prairie Bluff - Heritage Collection
- Pierce Plan at Prairie Bluff - Heritage Collection
- Lancaster Plan at Prairie Bluff - Heritage Collection
- Chesapeake Plan at Prairie Bluff - Heritage Collection
- Windsor Plan at Prairie Bluff - Heritage Collection
- Bridgeport Plan at Prairie Bluff - Heritage Collection
- Davenport Plan at Prairie Bluff - Heritage Collection
- Portsmouth Plan at Prairie Bluff - Heritage Collection
- Braxton Plan at Prairie Bluff - Heritage Collection
- 317 Switchgrass Landing Ln
- 5504 Dressel Dr
- 5576 Wavecrest Cir
- 6024 Mo-N Unit Lot 2
- 6025 Mo-N Unit Lot 1
- 1622 Piedmont Cir Unit 5C
- 500 Dunmore Place Ct
- 500 Dunmore Place Ct Unit 4
- 500 Dunmore Place Ct
- 504 Dunmore Place Ct
- 1149 Motherhead Rd
- 506 Dunmore Place Ct
- 601 Dunmore Place Dr
- 600 Dunmore Place Dr
- 601 Dunmore Place Dr Unit 3
- 601 Dunmore Place Dr
- 1159 Motherhead Rd
- 347 White Pine Dr
- 507 Dunmore Place Ct
- 603 Dunmore Place Dr
- 508 Dunmore Place Ct
- 42 Misty Ridge Ct
- 509 Dunmore Place Ct
- 509 Dunmore Place Ct Unit 13
- 342 White Pine Dr
- 602 Dunmore Place Dr Unit 16