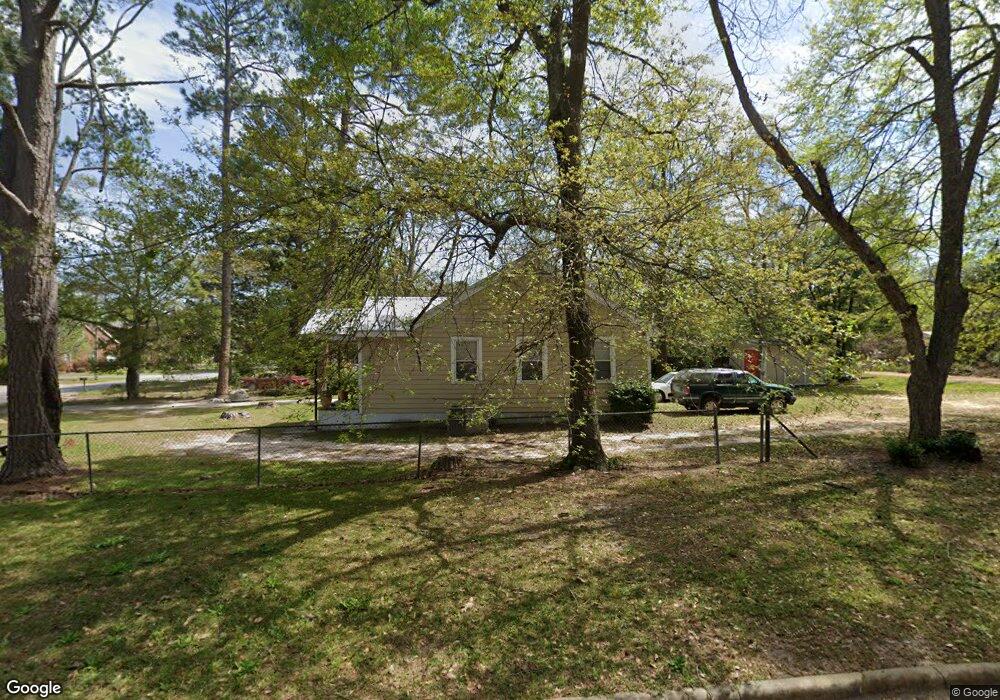
502 E 3rd Ave Cordele, GA 31015
Estimated Value: $70,000 - $101,000
2
Beds
1
Bath
757
Sq Ft
$112/Sq Ft
Est. Value
About This Home
This home is located at 502 E 3rd Ave, Cordele, GA 31015 and is currently estimated at $84,869, approximately $112 per square foot. 502 E 3rd Ave is a home located in Crisp County with nearby schools including Crisp County Elementary School, Crisp County Primary School, and Crisp County Middle School.
Ownership History
Date
Name
Owned For
Owner Type
Purchase Details
Closed on
Apr 27, 2012
Sold by
Gladney Gary Lee
Bought by
Gladney Gary Lee and Gladney Larry James
Current Estimated Value
Purchase Details
Closed on
Sep 6, 2011
Sold by
Coralee Webb and Tignor Sandra
Bought by
Gladney Gary Lee
Purchase Details
Closed on
Dec 4, 2007
Sold by
Webb Coralee
Bought by
Open Portals Llc
Purchase Details
Closed on
Aug 17, 2007
Sold by
Whelchel Tina B
Bought by
Webb Coralee and Webb Tignor Sandra
Home Financials for this Owner
Home Financials are based on the most recent Mortgage that was taken out on this home.
Original Mortgage
$34,400
Interest Rate
6.7%
Mortgage Type
New Conventional
Purchase Details
Closed on
Nov 16, 2006
Sold by
Bagwell Cecil L
Bought by
Whelchel Tina B and Speers Lisa B
Purchase Details
Closed on
Jul 8, 1987
Bought by
Bagwell Cecil L
Create a Home Valuation Report for This Property
The Home Valuation Report is an in-depth analysis detailing your home's value as well as a comparison with similar homes in the area
Purchase History
| Date | Buyer | Sale Price | Title Company |
|---|---|---|---|
| Gladney Gary Lee | $11,101 | -- | |
| Gladney Gary Lee | $11,100 | -- | |
| Open Portals Llc | -- | -- | |
| Webb Coralee | $43,000 | -- | |
| Whelchel Tina B | -- | -- | |
| Bagwell Cecil L | $23,500 | -- |
Source: Public Records
Mortgage History
| Date | Status | Borrower | Loan Amount |
|---|---|---|---|
| Previous Owner | Webb Coralee | $34,400 |
Source: Public Records
Tax History
| Year | Tax Paid | Tax Assessment Tax Assessment Total Assessment is a certain percentage of the fair market value that is determined by local assessors to be the total taxable value of land and additions on the property. | Land | Improvement |
|---|---|---|---|---|
| 2025 | $792 | $22,463 | $1,400 | $21,063 |
| 2024 | $731 | $20,398 | $1,400 | $18,998 |
| 2023 | $730 | $19,470 | $1,400 | $18,070 |
| 2022 | $487 | $18,436 | $1,400 | $17,036 |
| 2021 | $478 | $17,404 | $1,400 | $16,004 |
| 2020 | $490 | $17,404 | $1,400 | $16,004 |
| 2019 | $494 | $17,404 | $1,400 | $16,004 |
| 2018 | $689 | $23,381 | $2,100 | $21,281 |
| 2017 | $949 | $23,381 | $2,100 | $21,281 |
| 2016 | $691 | $23,381 | $2,100 | $21,281 |
| 2015 | -- | $23,381 | $2,100 | $21,281 |
| 2014 | -- | $23,381 | $2,100 | $21,281 |
| 2013 | -- | $23,381 | $2,100 | $21,281 |
Source: Public Records
Map
Nearby Homes